Skip to content
X-twitter Linkedin Youtube
  • Home
  • Premium Content
  • Insights
  • Events
  • Industry Links
    • Coal Consultants
    • Coal Industry Association
    • Coal Industry News
    • Coal Price & Market Information
    • Government Organisation
    • Think Tank
    • Coal Company
  • About Us
  • Other Hubs
    • EUROPEAN GAS HUB
    • GLOBAL LNG HUB
    • GLOBAL MARITIME HUB
    • GLOBAL HYDROGEN HUB
    • GLOBAL MINERALS HUB
  • FREE TRIAL
  • My account
  • Login
€0.00 0 Cart
€0.00 0 Cart
  • Home
  • Premium Content
  • Insights
  • Events
  • Industry Links
    • Coal Consultants
    • Coal Industry Association
    • Coal Industry News
    • Coal Price & Market Information
    • Government Organisation
    • Think Tank
    • Coal Company
  • About Us
  • Other Hubs
    • EUROPEAN GAS HUB
    • GLOBAL LNG HUB
    • GLOBAL MARITIME HUB
    • GLOBAL HYDROGEN HUB
    • GLOBAL MINERALS HUB
  • FREE TRIAL
  • My account
  • Login
X-twitter Linkedin Youtube

© 2025 TheCoalHub | All Rights Reserved

Archives: Reports & Presentations

Bar chart of annual coal demand changes by region (2023–2025): World, China, India, Southeast Asia, United States, and European Union likely values shown.

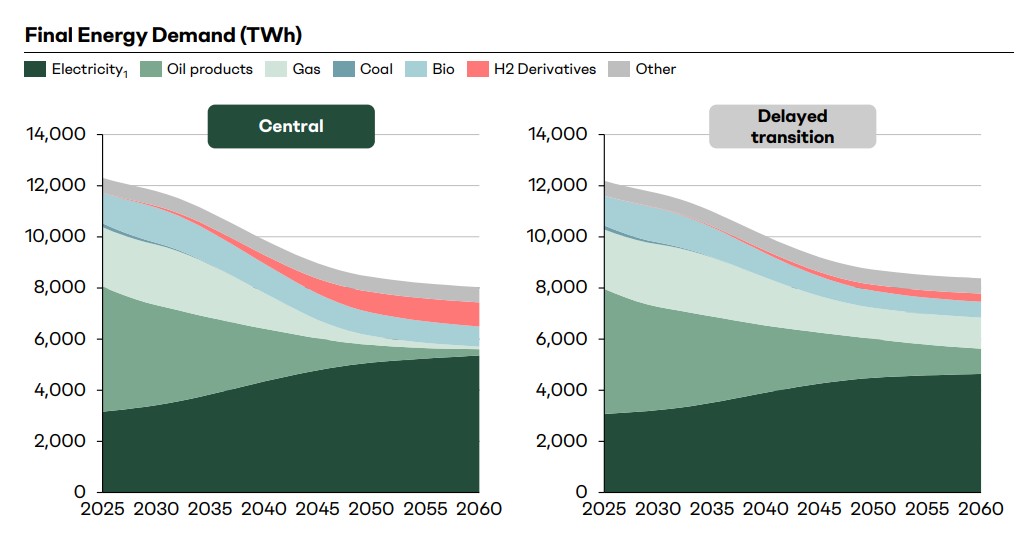
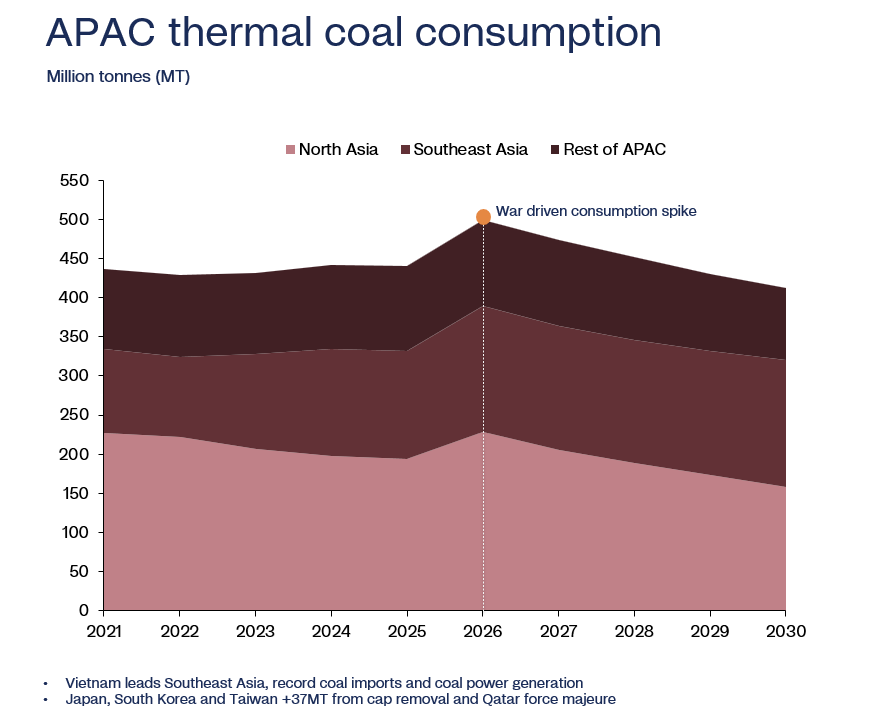
Global coal demand stabilises as power markets undergo structural shift

  • April 27, 2026

Met coal demand to decline as green steel transition accelerates?

  • April 27, 2026
Diagram showing sustainable coal stewardship framework covering pre-combustion, combustion and beyond combustion stages

Coal blind spots in energy security and transition policy

  • April 27, 2026
Bar chart comparing Australian (blue) and US (yellow) coking coal import prices to India (INR/tonne) across years 2015–16 to 2024–25, by year edge-to-edge.

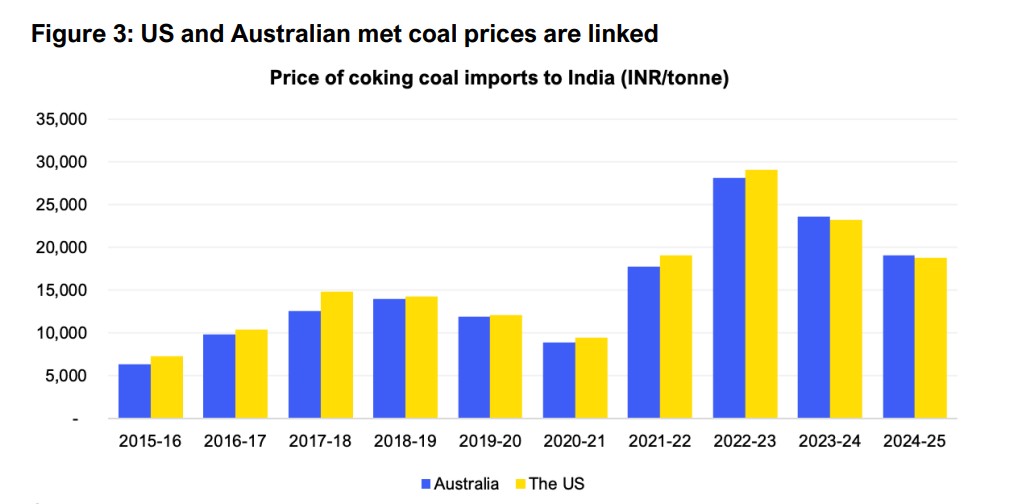
US met coal offers limited relief for India’s energy security

  • April 27, 2026
Stacked bar chart comparing capacity and generation by energy source: Thermal, Hydro, Nuclear, Wind, and PV. The Capacity bar shows a large Thermal portion with PV at the top; the Generation bar is dominated by Thermal with smaller shares of Hydro, Nuclear, Wind, and PV.

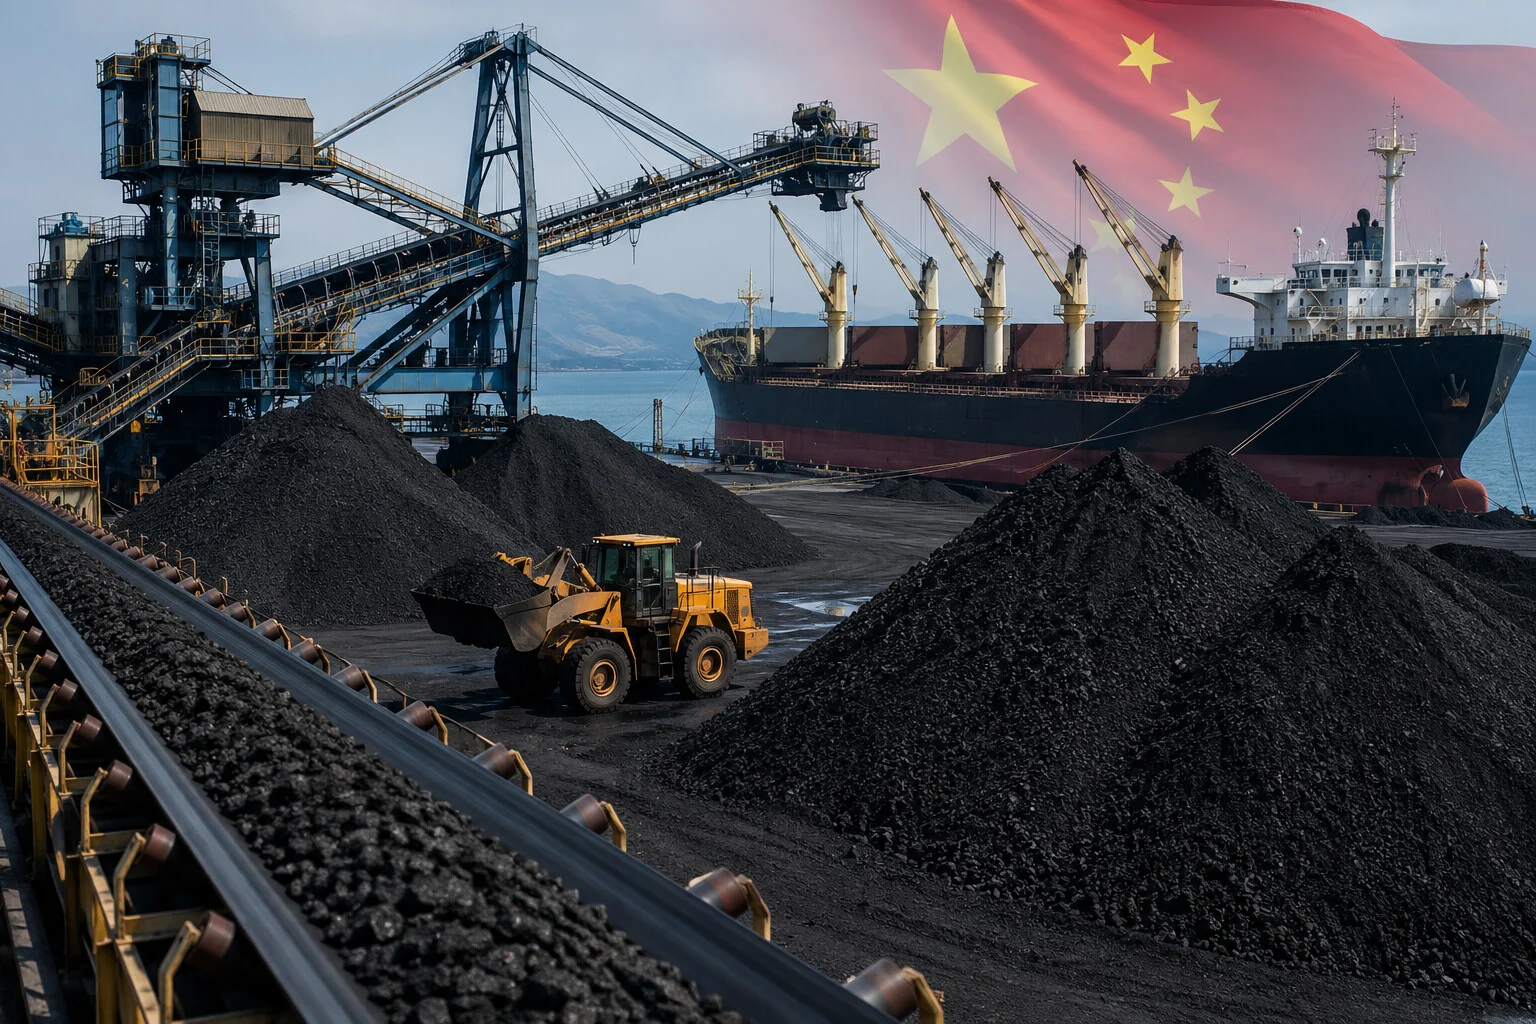
China power sector reform and coal capacity risks

  • April 27, 2026
One-year chart of ICE API2 Rotterdam Coal Futures showing a price around 103.8 on Apr 24, 2026 with a noticeable March spike.

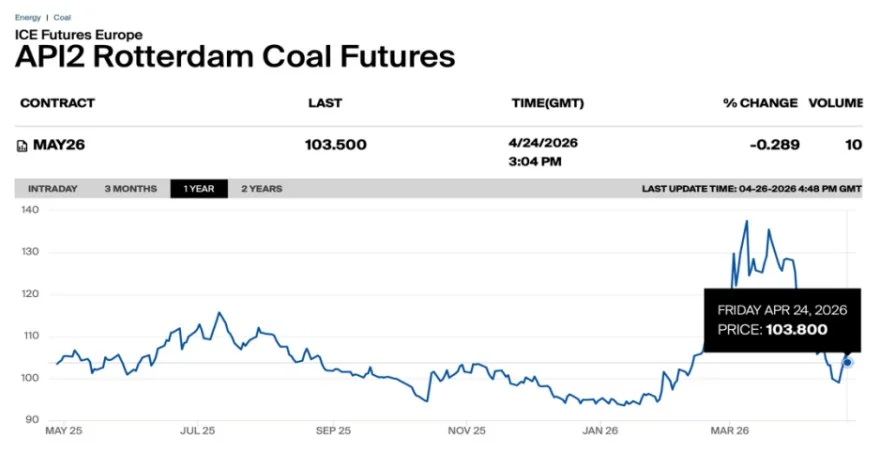
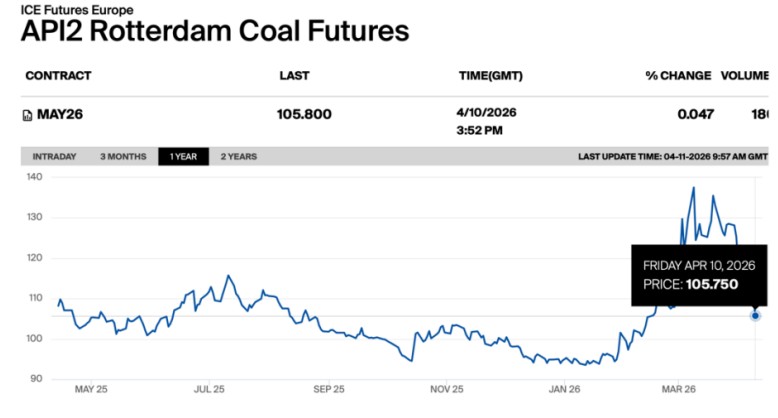
Global coal prices show mixed trends as supply constraints support gains while weak demand caps upside

  • April 27, 2026
India petcoke imports monthly trend showing decline in March 2026

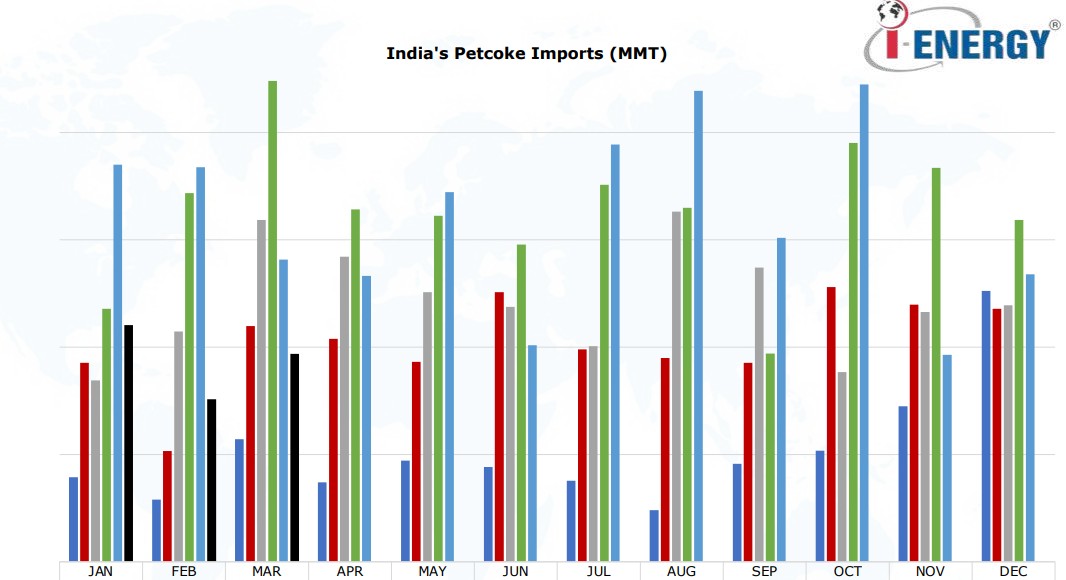
India petcoke imports decline sharply in March 2026 as coal gains competitiveness

  • April 27, 2026
India thermal coal imports monthly trend from 2021 to 2026 in million metric tons

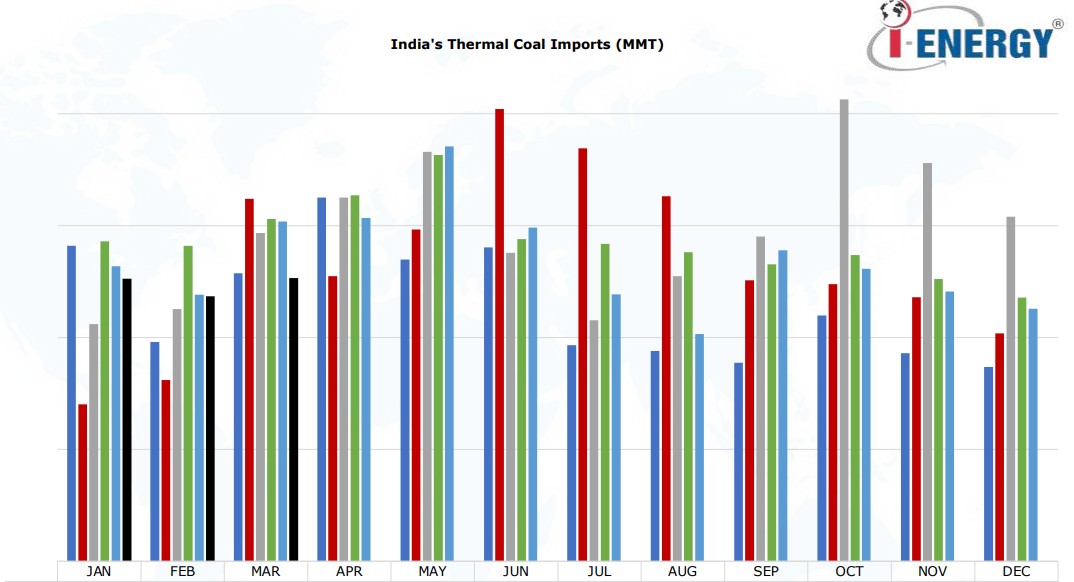
India coal imports fell in March 2026 as thermal coal demand weakened

  • April 27, 2026
API2 Rotterdam coal futures chart showing global coal prices trend for May 2026 contract at around $105.8 with recent volatility

Global coal prices fall sharply as easing tensions and weak demand weigh on markets

  • April 20, 2026
Chart comparing final energy demand by fuel type in Europe under central and delayed transition scenarios

Slower energy transition extends thermal generation in European power markets

  • April 20, 2026
Previous Page1 … Page3 Page4 Page5 Page6 Page7 … Page206 Next
Recent Post
Asian metallurgical coal export destinations showing South China, Japan and India as the largest markets by share of shipments

South Asian coal demand supports stronger seaborne flows

June 15, 2026
China coal market and metallurgical coal trade at a bulk export terminal with stockpiles, conveyor systems and a bulk carrier vessel

Met coal market volatility rises as China supply concerns unsettle trade

June 15, 2026
APAC thermal coal consumption forecast showing a war-driven spike in coal demand in 2026 as LNG shortages increase coal-fired power generation across Asia.

Asian coal demand rises as LNG shortages force utilities back to coal

June 8, 2026
Black-and-white image of coal handling equipment loading coal onto a stockpile.

Russian coal companies face rising losses in Q1 2026

June 6, 2026
Trending Posts
Daltransugol-capacity-hike

Daltransugol boosts coal handling capacity up to 33 mio t

June 10, 2025
Quarterly U.S. coal exports from 1Q2020 to 2Q2025 showing a decline in 2025

U.S. coal exports fall 11% in first half of 2025 as China demand drops

November 10, 2025
Chinese coking coal demand

China’s coking coal demand unperturbed by price rises

May 13, 2021
Chart showing Indonesian thermal coal exports from 2022 to 2026, highlighting weaker export buffers ahead of a forecast El Niño event in mid-2026.

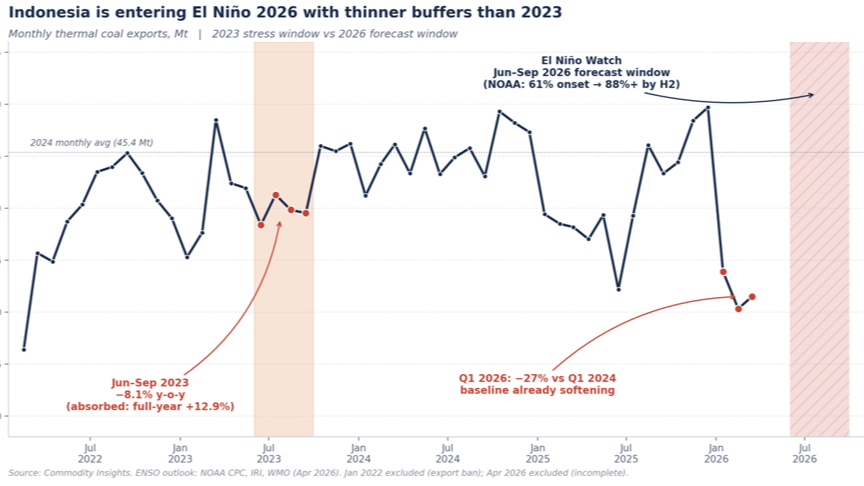
Indonesian coal exports face renewed El Niño risk as supply buffers weaken

May 19, 2026

Coal market intelligence platform featuring 1,300+ reports, presentations and industry insights, with new content added every week. more info

Categories

  • Coal Market Outlook
  • Trade and Prices
  • Met / Coking Coal
  • Coal Fired Generation
  • Coal Regions
  • Climate & Technology
  • Economic Impact
  • Petcoke

Recent Analysis

South Asian coal demand supports stronger seaborne flows

Met coal market volatility rises as China supply concerns unsettle trade

Asian coal demand rises as LNG shortages force utilities back to coal

Weekly Updates

Sign up to receive our weekly newsletter (each Monday) with new coal market reports, presentations & analysis.

Your subscription could not be saved. Please try again.
Your subscription has been successful.

By signing up, I agree to our TOS and Privacy Policy.

© 2025 TheCoalHub | All Rights Reserved

X-twitter Linkedin Youtube