Skip to content
Search
X-twitter
Linkedin
Youtube
Home
Premium Content
Insights
Events
Industry Links
Coal Consultants
Coal Industry Association
Coal Industry News
Coal Price & Market Information
Government Organisation
Think Tank
Coal Company
About Us
Other Hubs
EUROPEAN GAS HUB
GLOBAL LNG HUB
GLOBAL MARITIME HUB
GLOBAL HYDROGEN HUB
GLOBAL MINERALS HUB
FREE TRIAL
My account
Login
€
0.00
0
Cart
€
0.00
0
Cart
Search
Home
Premium Content
Insights
Events
Industry Links
Coal Consultants
Coal Industry Association
Coal Industry News
Coal Price & Market Information
Government Organisation
Think Tank
Coal Company
About Us
Other Hubs
EUROPEAN GAS HUB
GLOBAL LNG HUB
GLOBAL MARITIME HUB
GLOBAL HYDROGEN HUB
GLOBAL MINERALS HUB
FREE TRIAL
My account
Login
X-twitter
Linkedin
Youtube
© 2025 TheCoalHub | All Rights Reserved
Archives: Reports & Presentations
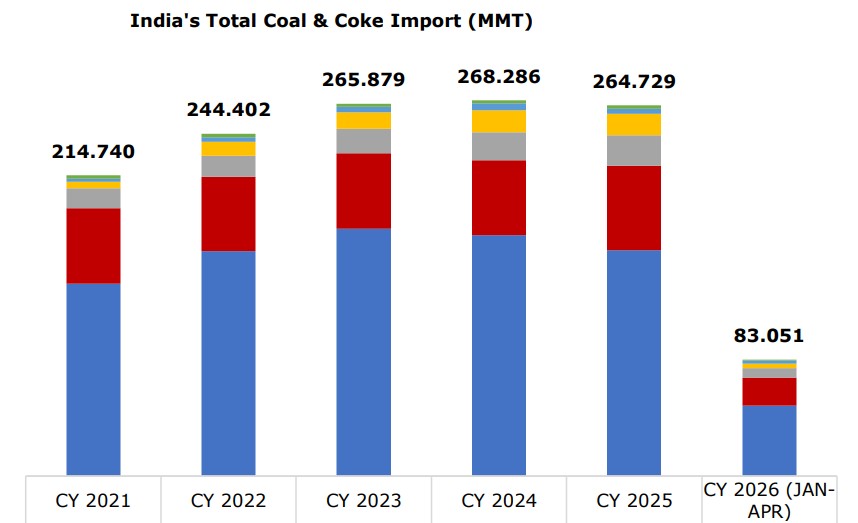
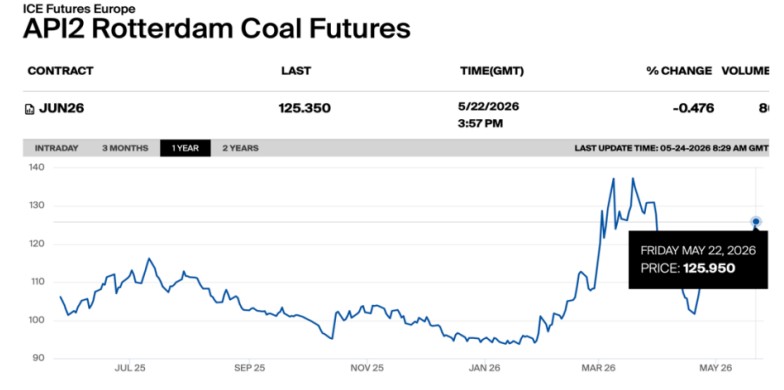
Global coal prices stay cautious as India’s coal and coke imports rise in April
May 26, 2026
Global coal prices strengthen on firm China demand and export market support
May 25, 2026
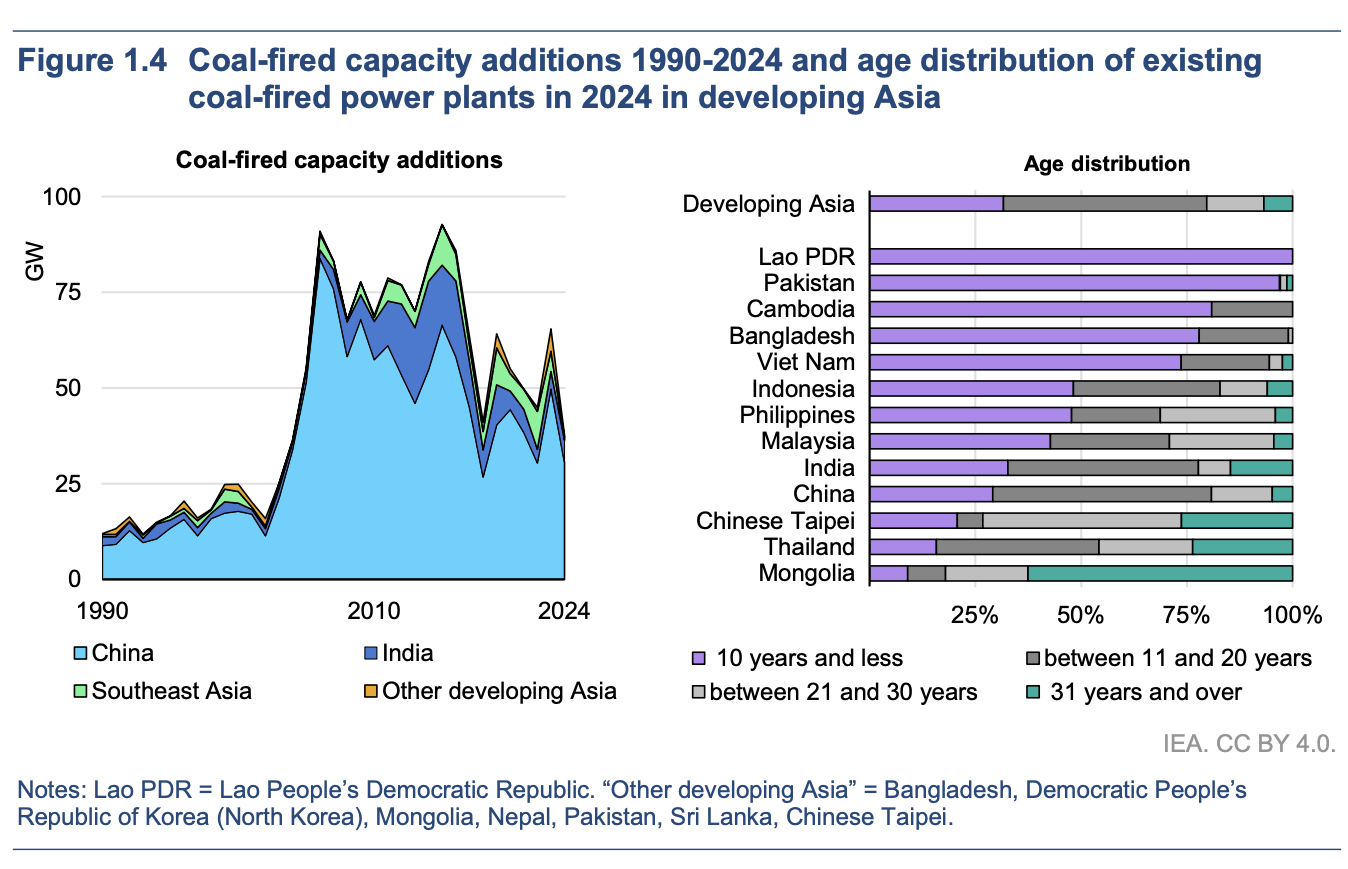
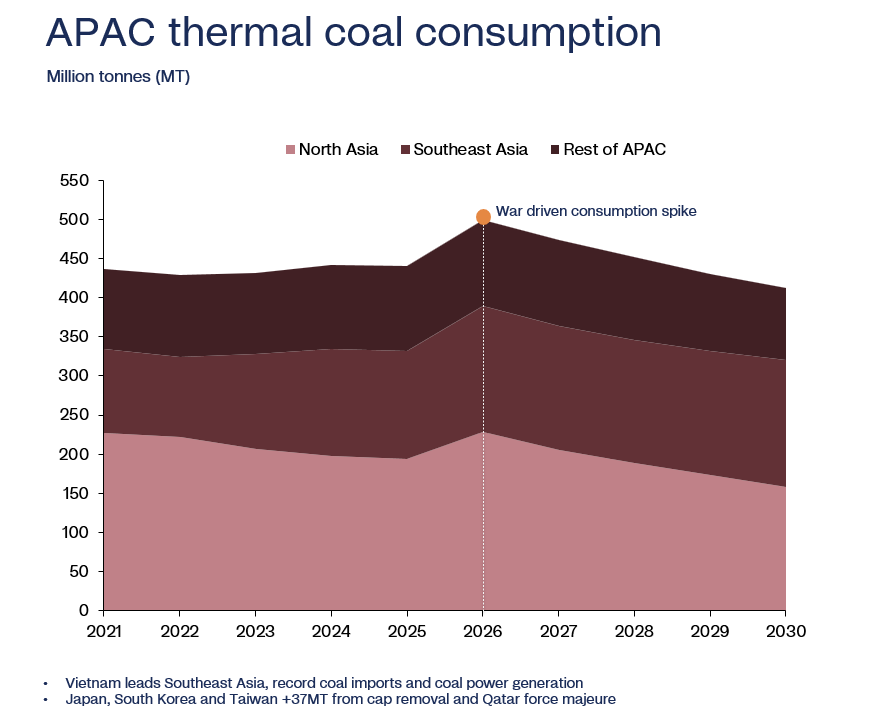
Coal power dependence in Southeast Asia may prove difficult to unwind
May 19, 2026
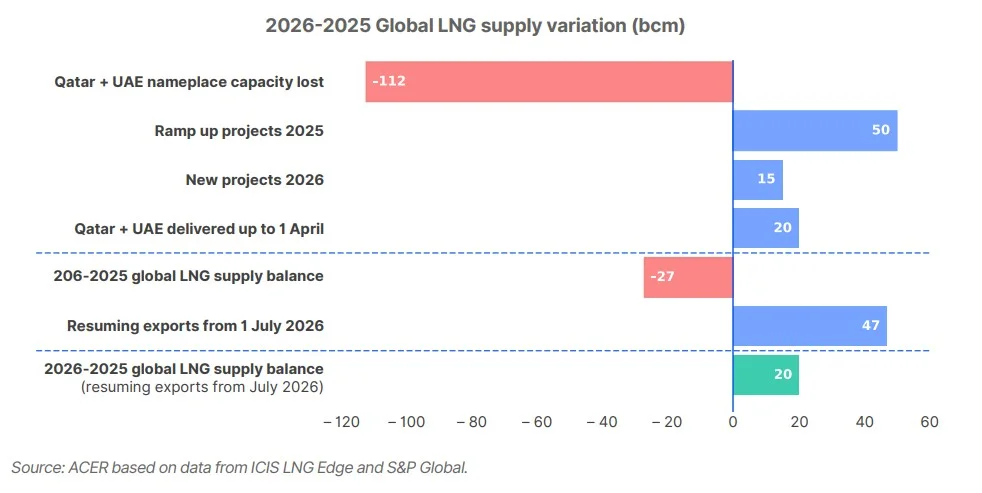
Coal power generation returns as LNG crisis tightens global gas markets
May 18, 2026
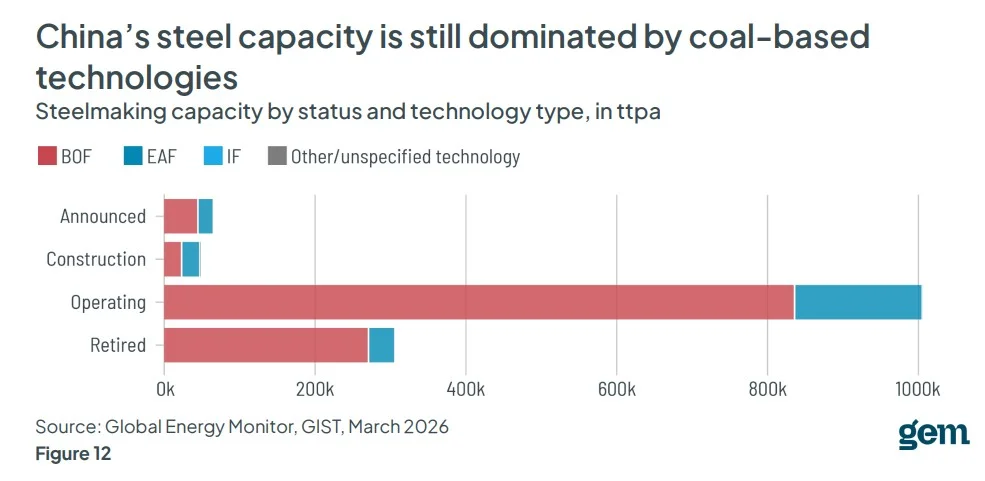
Steel industry keeps betting on metallurgical coal despite green steel push
May 18, 2026
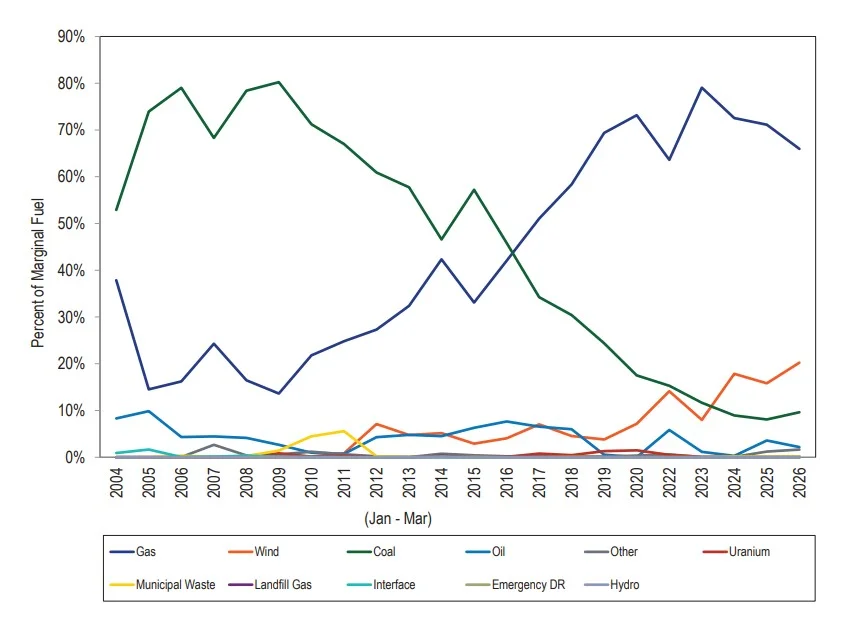
AI-driven power demand boosts coal power generation economics in US capacity markets
May 18, 2026
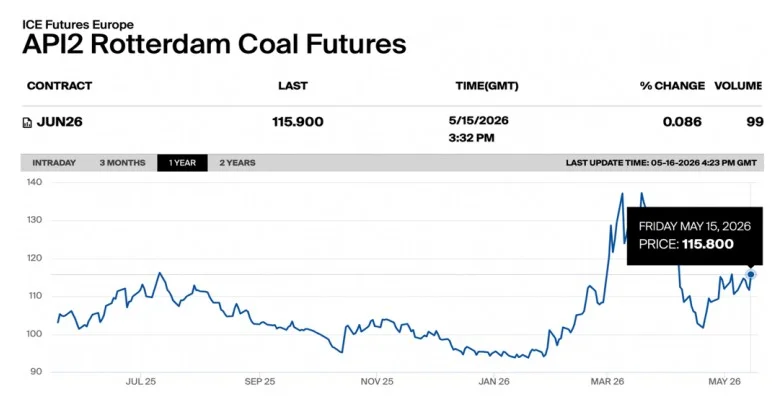
Global coal prices rise as energy market volatility and supply concerns support coal futures
May 18, 2026
China coal demand gains as Hormuz crisis reinforces energy security concerns
May 12, 2026
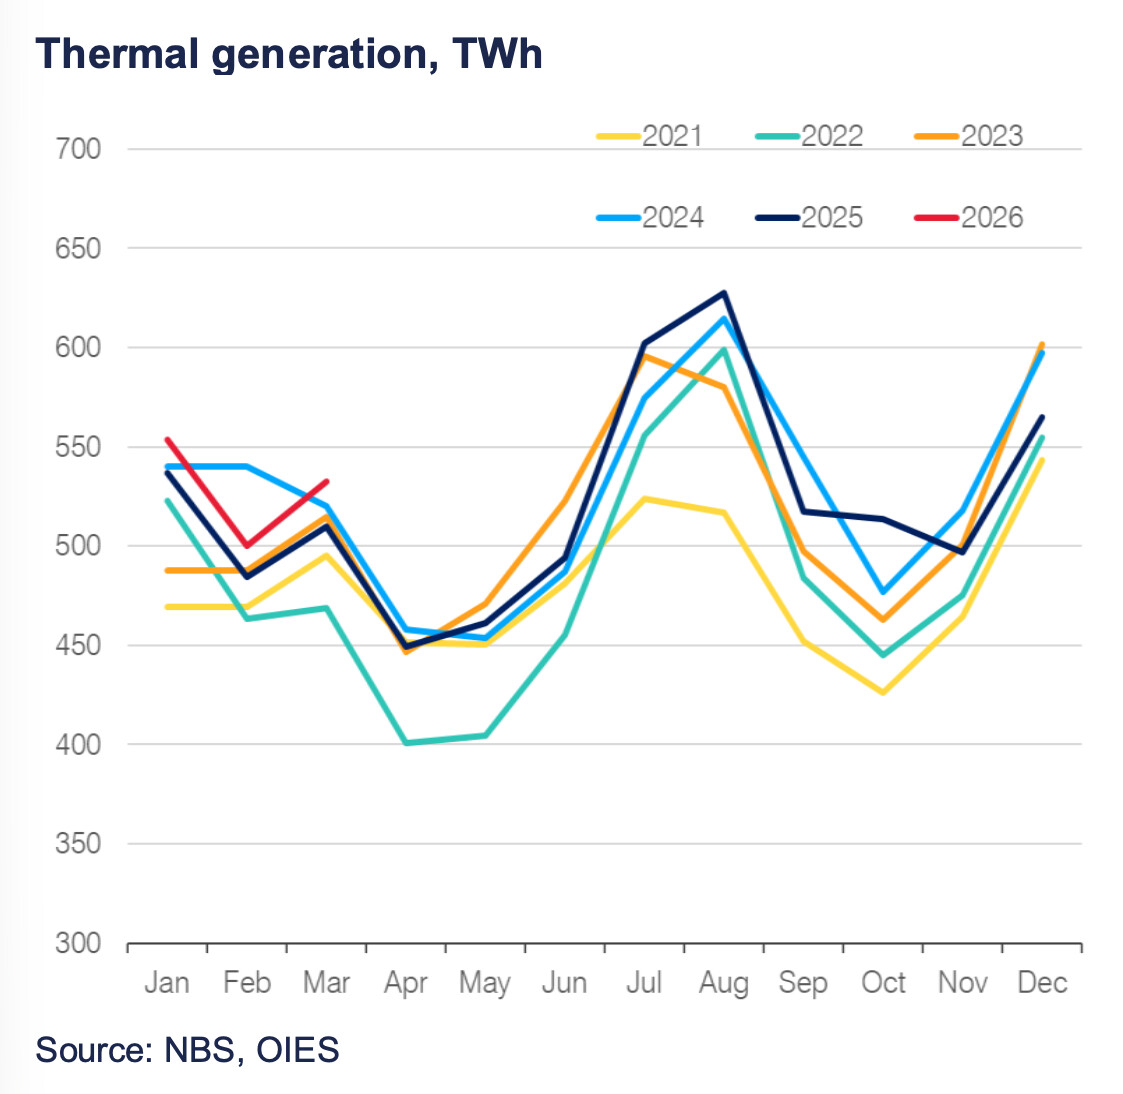
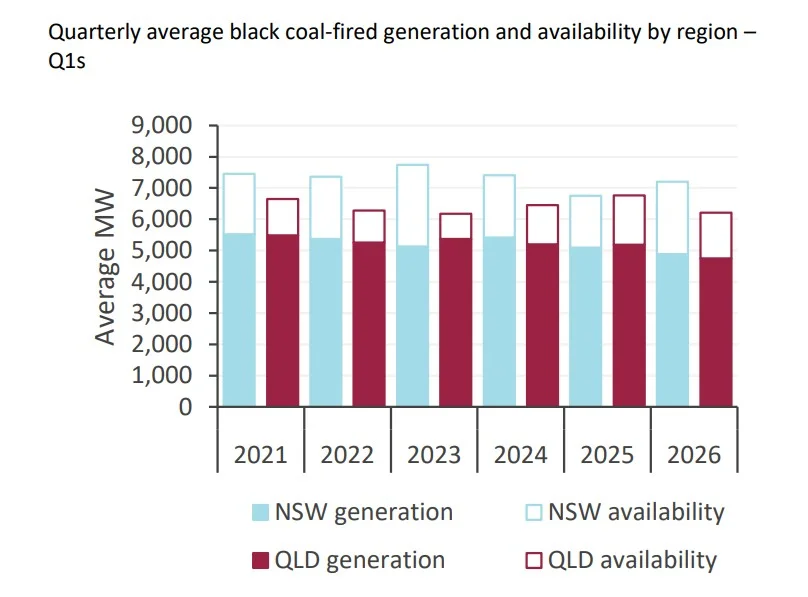
Australian coal generation holds in evolving power market dynamics
May 12, 2026
India coal generation remains dominant despite rapid renewable growth
May 12, 2026
Previous
Page
1
Page
2
Page
3
Page
4
Page
5
…
Page
206
Next
Recent Post
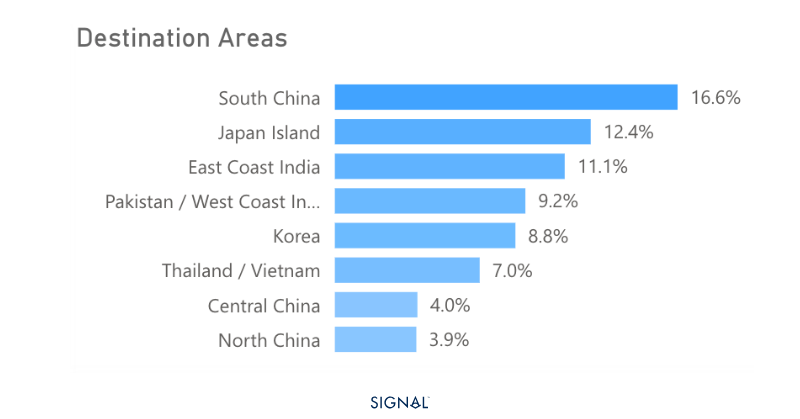
South Asian coal demand supports stronger seaborne flows
June 15, 2026
Met coal market volatility rises as China supply concerns unsettle trade
June 15, 2026
Asian coal demand rises as LNG shortages force utilities back to coal
June 8, 2026
Russian coal companies face rising losses in Q1 2026
June 6, 2026
Trending Posts
Fuel Switching Update
November 12, 2020
‘Dual controls’ may delay China’s coking coal operations
September 3, 2021
Construction of North-Siberian Railway estimated at 86 billion USD
April 1, 2024
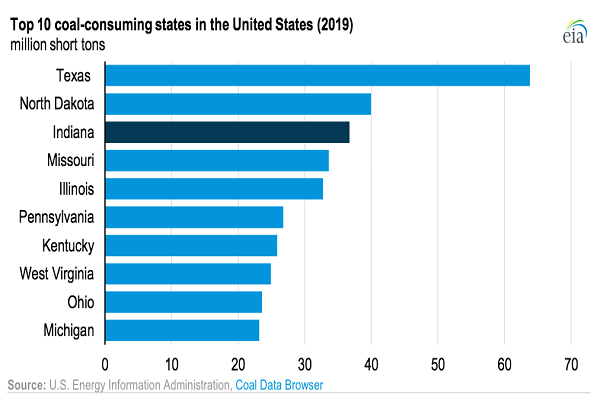
More Coal was Consumed in Indiana than in all but two U.S. States in 2019
October 9, 2020