US power market under pressure from growing demand and reliability risks

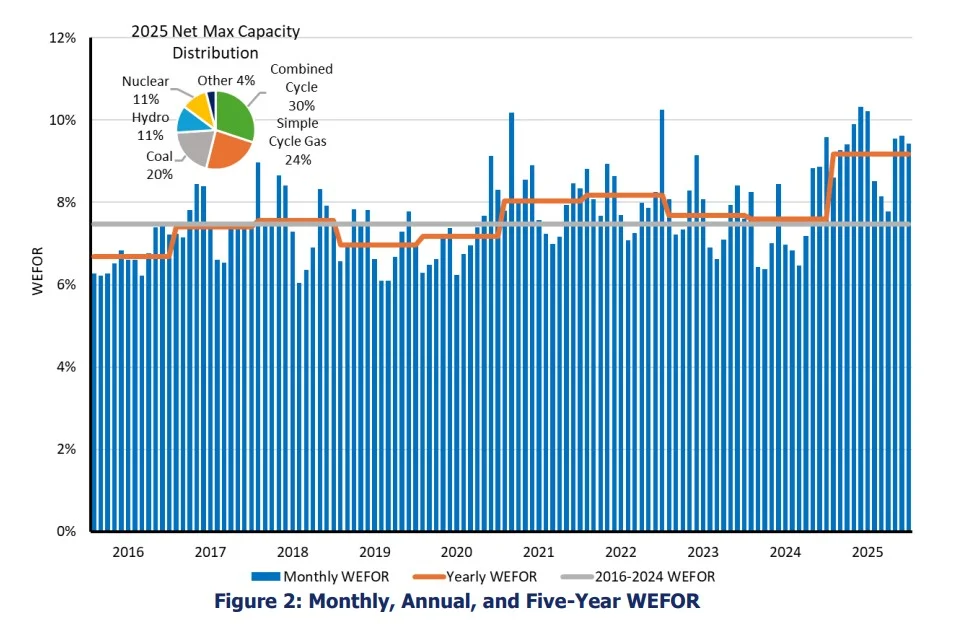
Composite chart of WEFOR values from 2016 to 2025. Dense blue bars show monthly WEFOR percentages around 6–10%, an orange line tracks yearly WEFOR, and a light gray line shows 2016–2024 WEFOR. Inset: 2025 Net Max Capacity Distribution pie chart—Coal 20%, Nuclear 11%, Hydro 11%, Simple Cycle Gas 24%, Combined Cycle 30%, Other 4%.

The US power market is facing growing reliability challenges as electricity demand continues to rise and the coal fleet experiences higher levels of forced outages, highlighting the increasing pressure on conventional generation. Annual energy demand reached nearly 4.95 million GWh in 2025, while conventional generation’s weighted equivalent forced outage rate increased to 9.2%, above the historical range of 7–8%. Pressure […]

This report is premium content Start a FREE 30-day trial to read this report and unlock our full library of 1,300+ coal market reports, white papers, and research studies. You’ll receive weekly content updates — and you can cancel anytime during the trial if it’s not for you.
FREE TRIAL
Already a subscriber ? Log in
RELATED POSTS