Skip to content
X-twitter Linkedin Youtube
  • Home
  • Premium Content
  • Insights
  • Events
  • Industry Links
    • Coal Consultants
    • Coal Industry Association
    • Coal Industry News
    • Coal Price & Market Information
    • Government Organisation
    • Think Tank
    • Coal Company
  • Other Hubs
    • EUROPEAN GAS HUB
    • GLOBAL LNG HUB
    • GLOBAL MARITIME HUB
    • GLOBAL HYDROGEN HUB
    • GLOBAL MINERALS HUB
  • FREE TRIAL
  • My account
  • Login
€0.00 0 Cart
€0.00 0 Cart
  • Home
  • Premium Content
  • Insights
  • Events
  • Industry Links
    • Coal Consultants
    • Coal Industry Association
    • Coal Industry News
    • Coal Price & Market Information
    • Government Organisation
    • Think Tank
    • Coal Company
  • Other Hubs
    • EUROPEAN GAS HUB
    • GLOBAL LNG HUB
    • GLOBAL MARITIME HUB
    • GLOBAL HYDROGEN HUB
    • GLOBAL MINERALS HUB
  • FREE TRIAL
  • My account
  • Login
X-twitter Linkedin Youtube

© 2025 TheCoalHub | All Rights Reserved

Archives: Reports & Presentations

API2 Rotterdam Coal Futures chart showing global coal prices falling, with May 2026 coal futures near $105.75 after a sharp weekly decline.

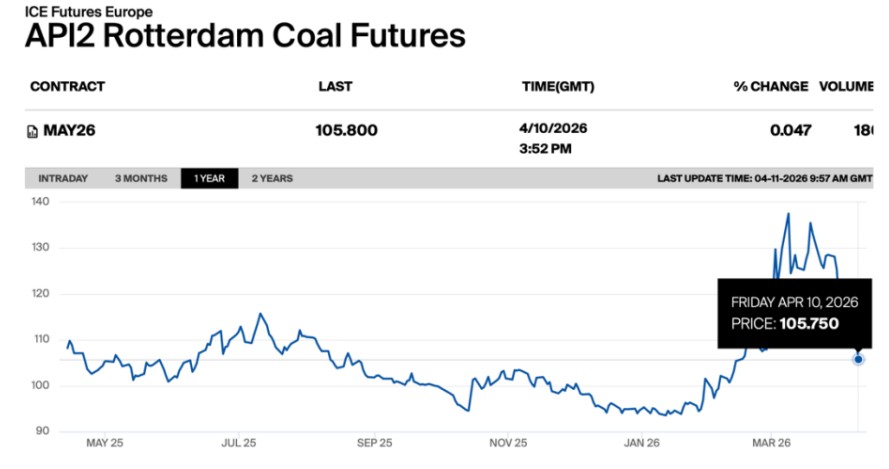
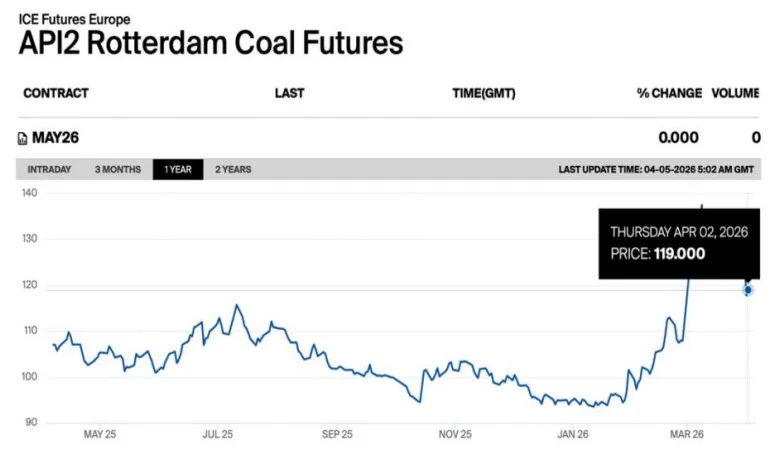
Global coal prices fall as API2 drops sharply and thermal coal markets soften

  • April 13, 2026
Bar chart comparing coal and solar levelised cost of electricity across ASEAN countries in 2024

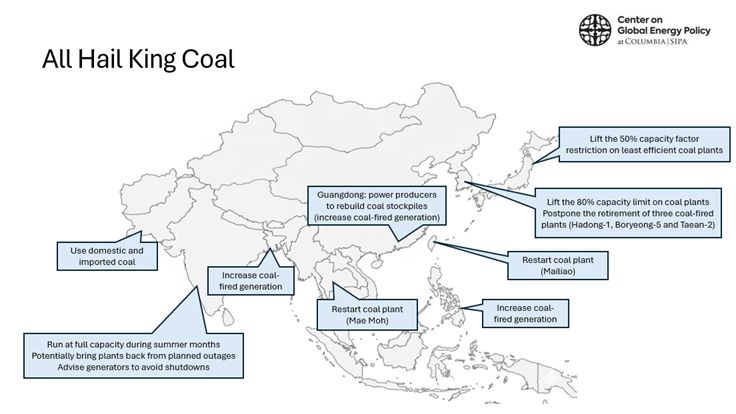
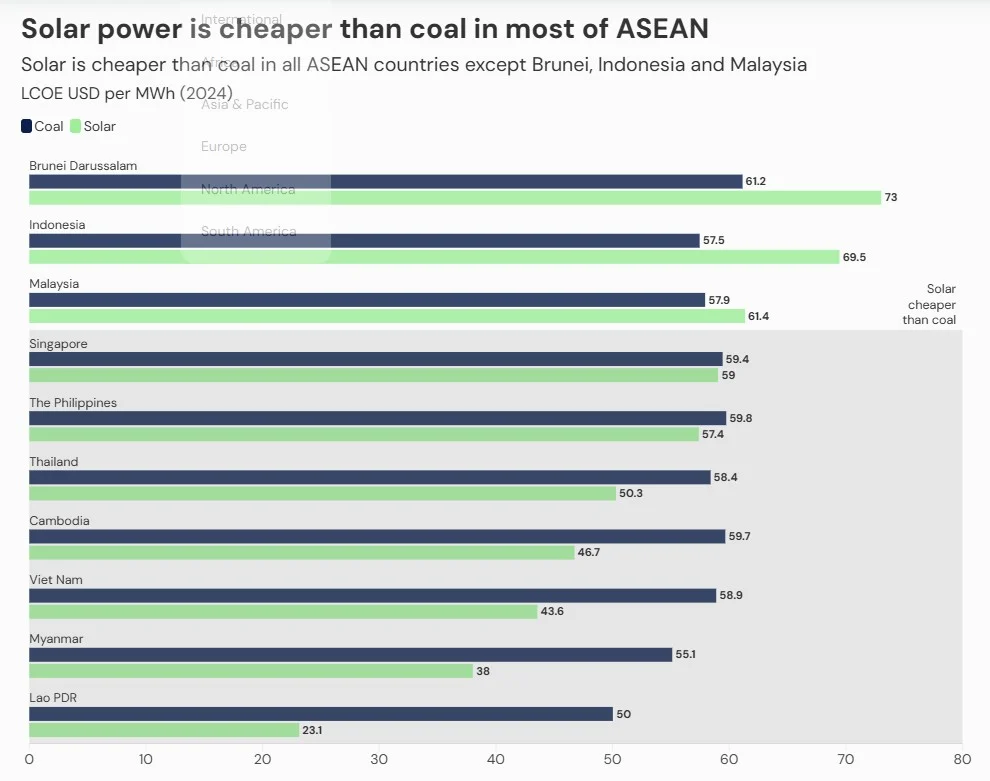
Coal economics in Southeast Asia’s energy crisis

  • April 13, 2026
Line chart showing annual US electric power coal consumption declining from around 1 billion short tons in the early 2000s to about 400 million short tons by 2024.

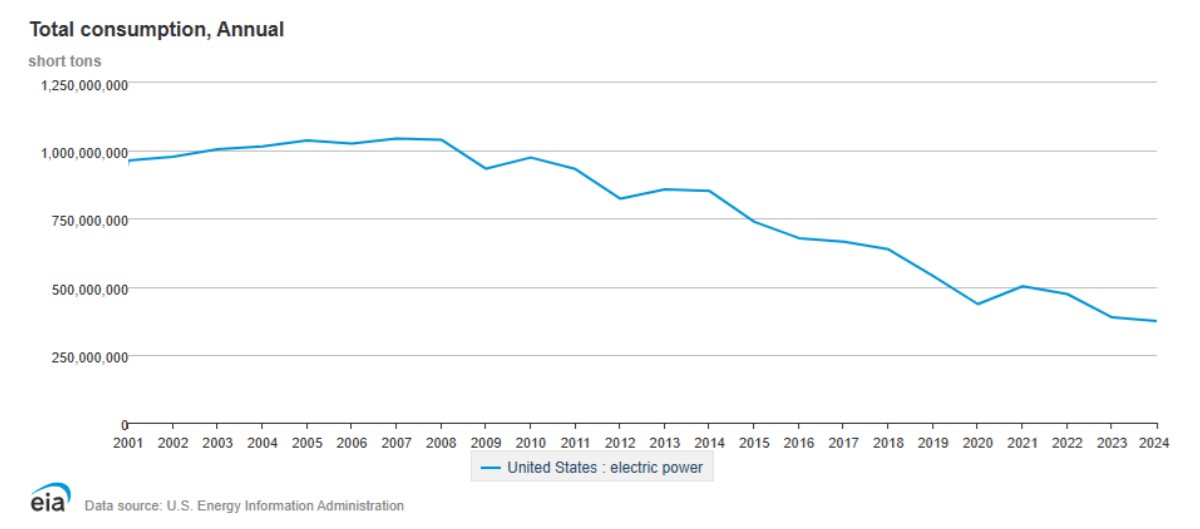
US coal plays strategic role in energy security

  • April 13, 2026
Line chart showing monthly changes in U.S. coal stocks held by the electric power sector, with inventory builds in early 2026 and smaller draws later in the year.

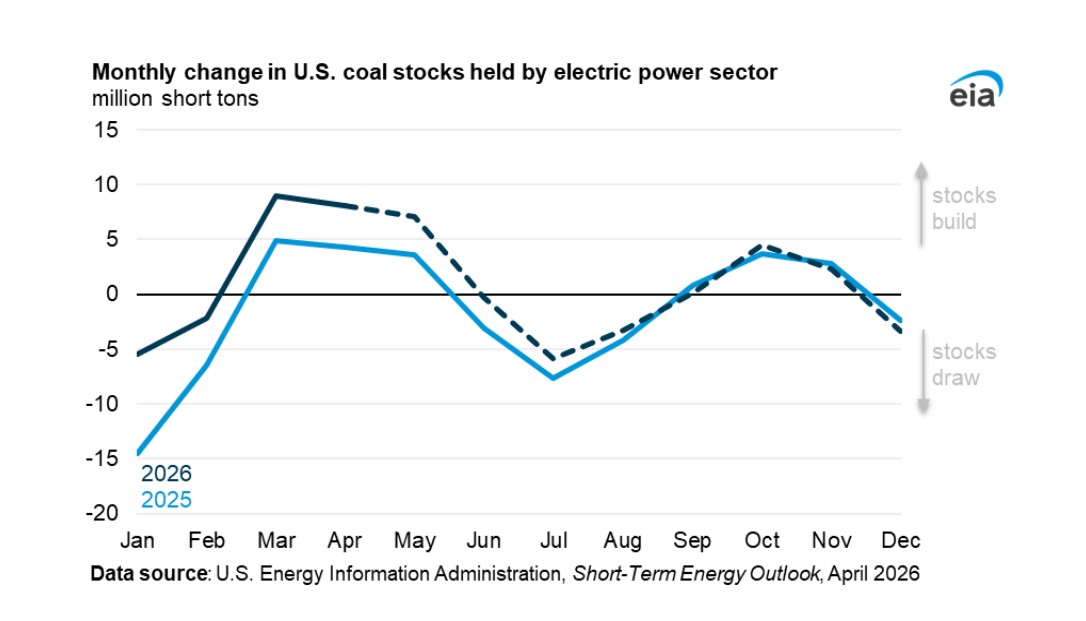
U.S. coal outlook 2026 shows lower power burn and stock builds

  • April 13, 2026
Bar chart showing India’s projected imports of coking coal, PCI, and met coke from 2022 to 2030, with steady growth led by coking coal demand.

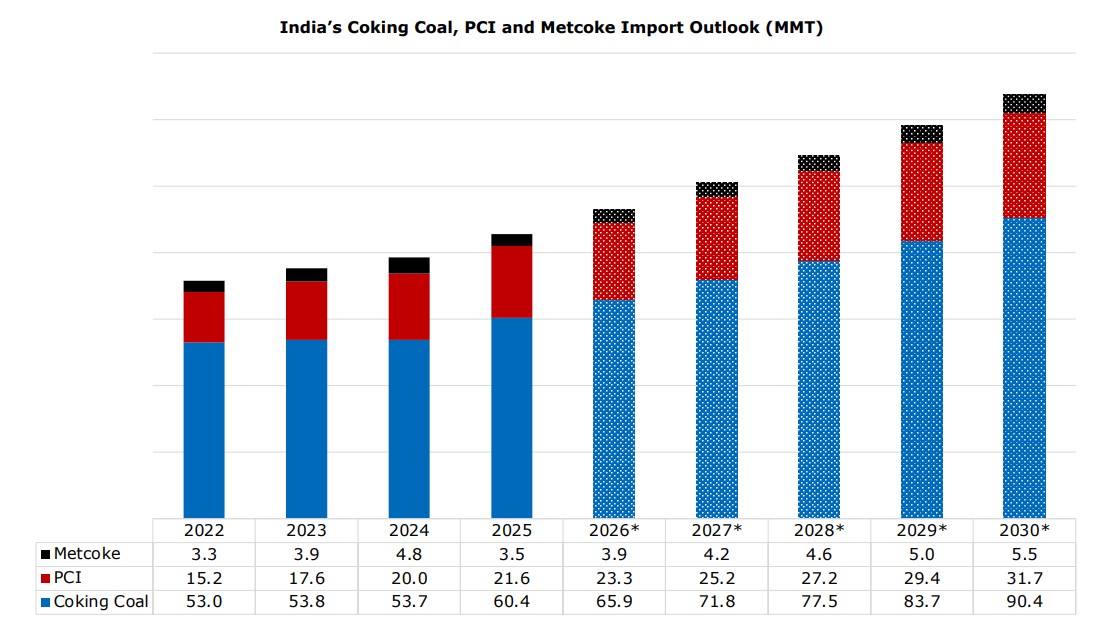
India met coke market outlook highlights steel growth and import trends

  • April 13, 2026
API2 Rotterdam Coal Futures one-year price chart showing a sharp rise in late March 2026, with the April 2, 2026 price at 119 USD per tonne.

Global coal prices slip on weak demand despite volatile gas and tight supply signals

  • April 7, 2026
Pie chart showing India’s installed grid-interactive renewable power capacity mix as of 31 March 2025, led by solar power at 61.29% and wind at 29.03%.

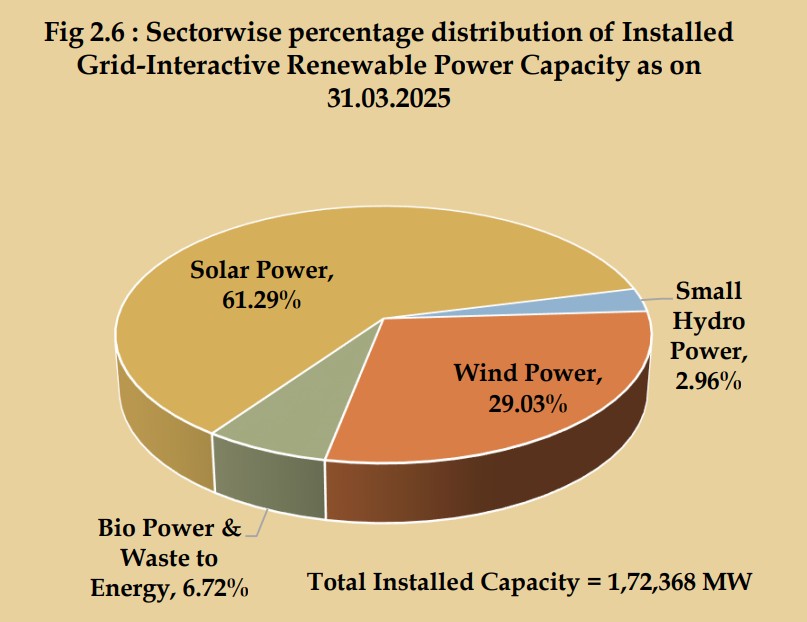
India energy statistics 2026 shows coal dominance and rising renewable capacity

  • April 7, 2026
Line chart showing Taiwan’s coal consumption and imports from 2015 to 2024, declining to 63 million short tons in 2024.

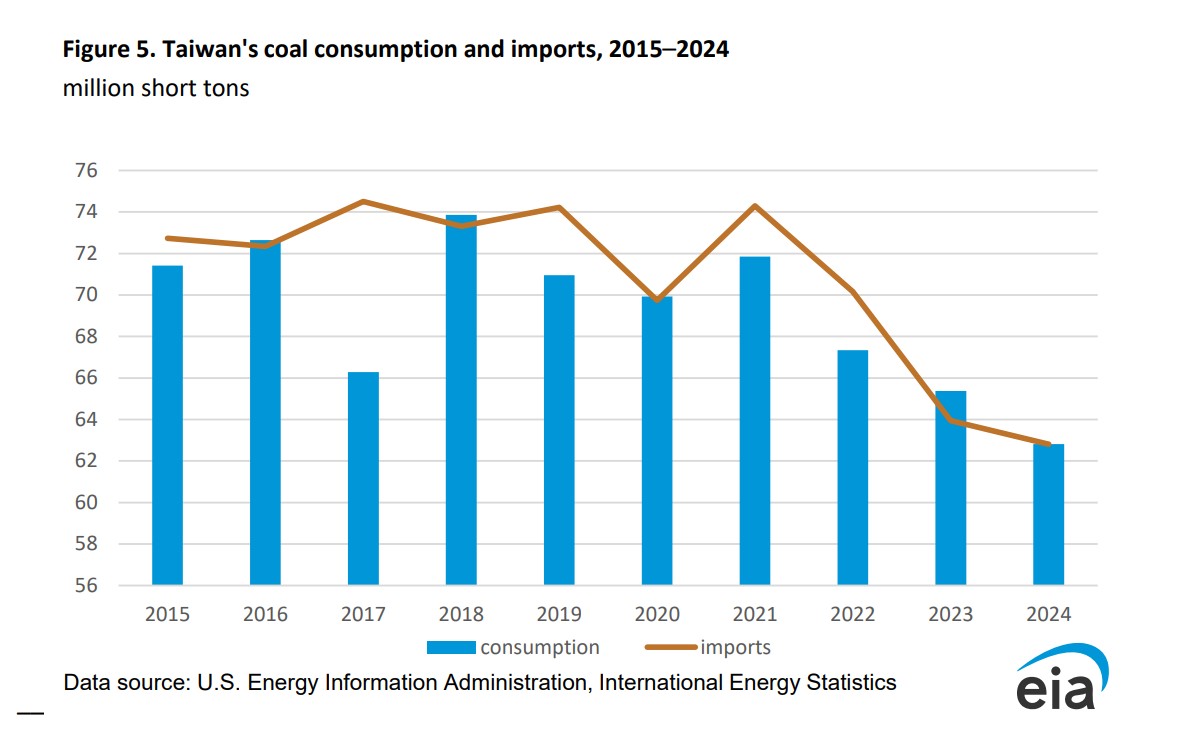
Taiwan coal phase-out plans highlight limits to transition

  • April 7, 2026
Bar chart showing the top five U.S. coal origin states and destination states in the fourth quarter of 2025, with Wyoming leading origins and Texas leading destinations.

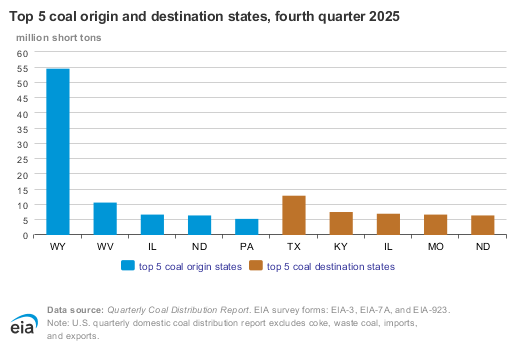
U.S. coal distribution eases in Q4 2025 despite annual growth

  • April 7, 2026
Bar chart showing that during Winter Storm Fern, most incremental electricity demand was met by dispatchable generation, led by natural gas and coal.

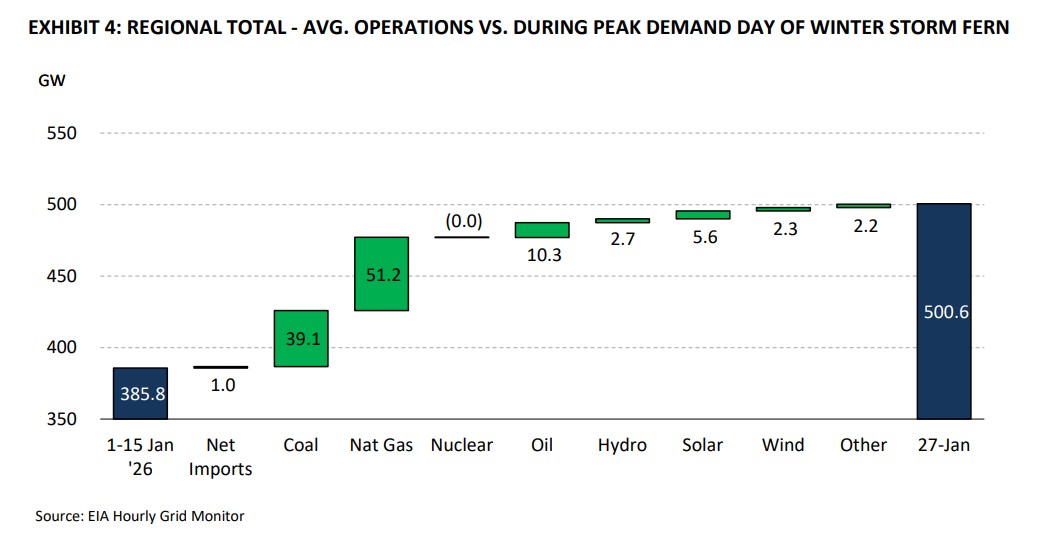
Winter Storm Fern coal generation shows why dispatchable power remains essential

  • April 7, 2026
Previous Page1 Page2 Page3 … Page201 Next
Recent Post
Coal switching measures across Asia as countries increase coal generation, restart plants and lift capacity limits during LNG supply disruption

Coal switching accelerates in Asia as LNG markets tighten

April 14, 2026
Turkish coal imports in Jan–Feb 2025 and Jan–Feb 2026, showing Russian volumes down to 4.0 mio t and market share down to 65.6%.

Russian coal exports to Turkey down 31% in Jan–Feb 2026

April 14, 2026
Russian coal train crossing a desert landscape on the route to China

Russian rail coal exports to China via border crossings plunge 22.6% in Q1 2026

April 14, 2026
Coal stockpiles and bulk carriers at a coal export terminal

Global coal prices decline as Europe weakens, China stays flat and Australia falls

April 14, 2026
Trending Posts
World-coal-market

World coal market: brief overview

September 25, 2023
China’s spot thermal coal prices

China’s spot thermal coal prices refresh record high

January 22, 2021
seaborne-coal

Global coal trade looks to be at a turning point

October 6, 2025
Coal is King

Coal is King (and will remain so)

March 11, 2021

The Coal Hub is an online platform for sharing analysis and information about the global coal market  more info

Categories

  • Coal Market Outlook
  • Trade and Prices
  • Met / Coking Coal
  • Coal Fired Generation
  • Coal Regions
  • Climate & Technology
  • Economic Impact
  • Petcoke

Recent Analysis

Coal switching accelerates in Asia as LNG markets tighten

Russian coal exports to Turkey down 31% in Jan–Feb 2026

Russian rail coal exports to China via border crossings plunge 22.6% in Q1 2026

Weekly Updates

Sign up to receive our weekly newsletter (each Monday) with new coal market reports, presentations & analysis.

Your subscription could not be saved. Please try again.
Your subscription has been successful.

By signing up, I agree to our TOS and Privacy Policy.

© 2025 TheCoalHub | All Rights Reserved

X-twitter Linkedin Youtube