Skip to content
Search
X-twitter
Linkedin
Youtube
Home
Premium Content
Insights
Events
Industry Links
Coal Consultants
Coal Industry Association
Coal Industry News
Coal Price & Market Information
Government Organisation
Think Tank
Coal Company
About Us
Other Hubs
EUROPEAN GAS HUB
GLOBAL LNG HUB
GLOBAL MARITIME HUB
GLOBAL HYDROGEN HUB
GLOBAL MINERALS HUB
FREE TRIAL
My account
Login
€
0.00
0
Cart
€
0.00
0
Cart
Search
Home
Premium Content
Insights
Events
Industry Links
Coal Consultants
Coal Industry Association
Coal Industry News
Coal Price & Market Information
Government Organisation
Think Tank
Coal Company
About Us
Other Hubs
EUROPEAN GAS HUB
GLOBAL LNG HUB
GLOBAL MARITIME HUB
GLOBAL HYDROGEN HUB
GLOBAL MINERALS HUB
FREE TRIAL
My account
Login
X-twitter
Linkedin
Youtube
© 2025 TheCoalHub | All Rights Reserved
Tag: coal-fired generation
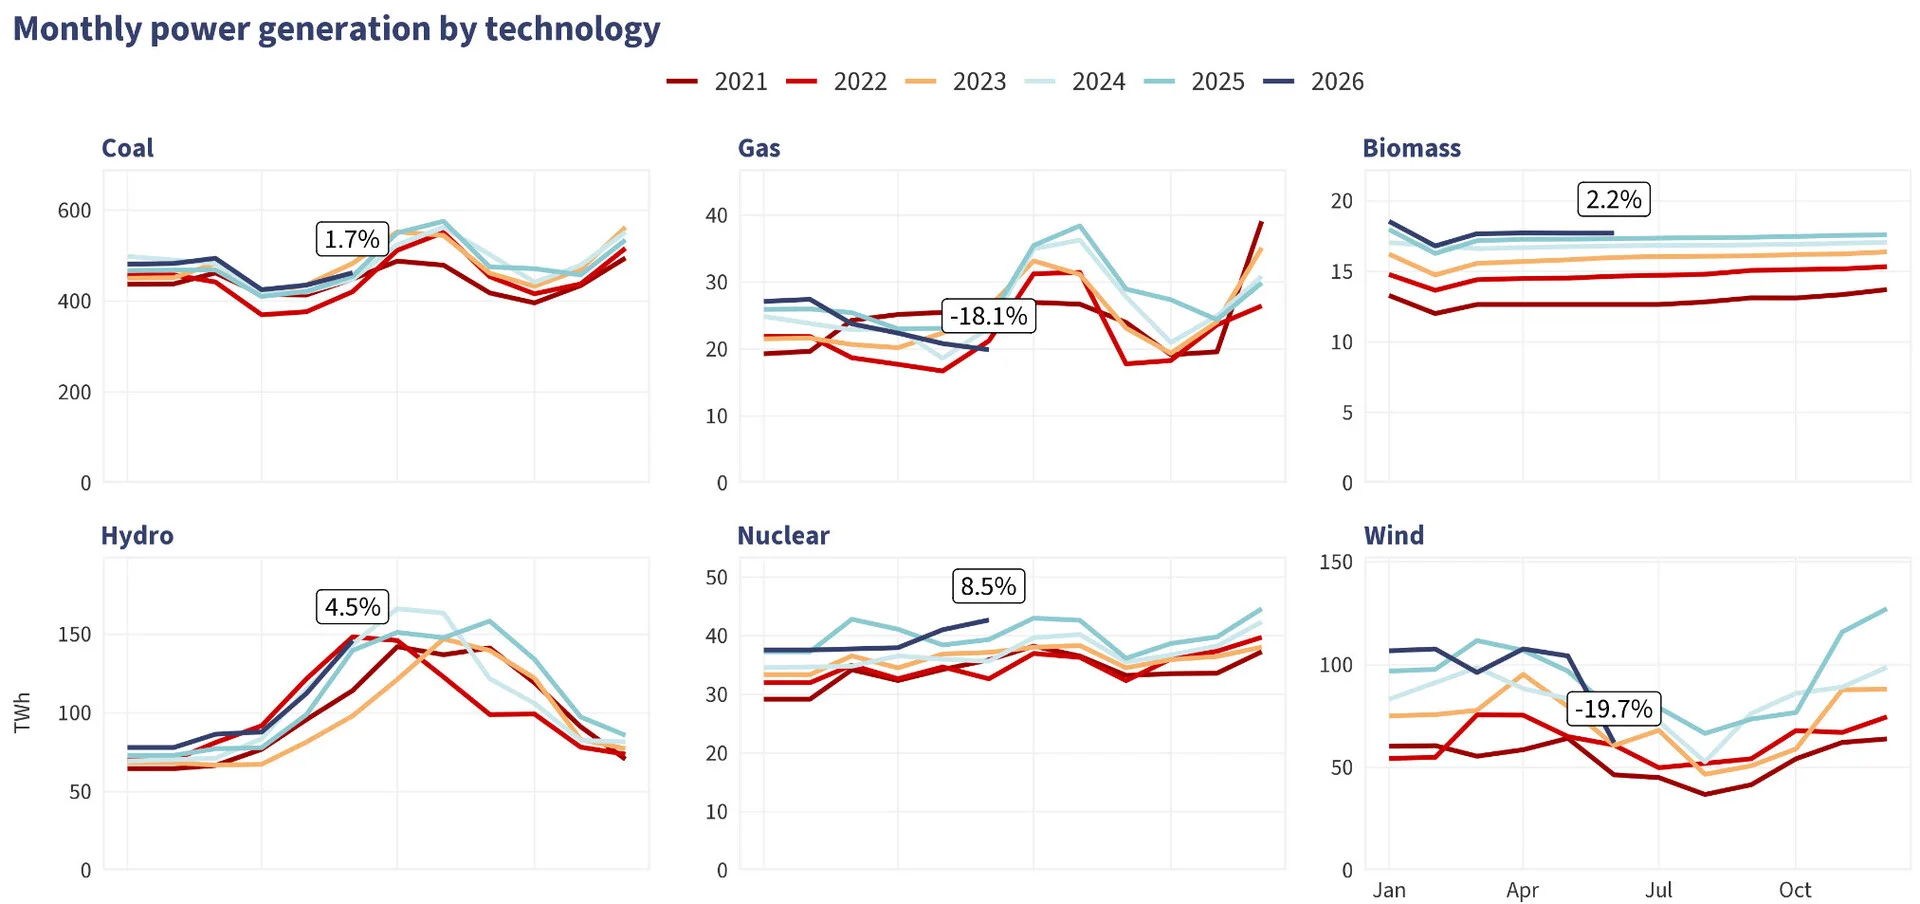
China coal power rises for sixth consecutive month
July 21, 2026
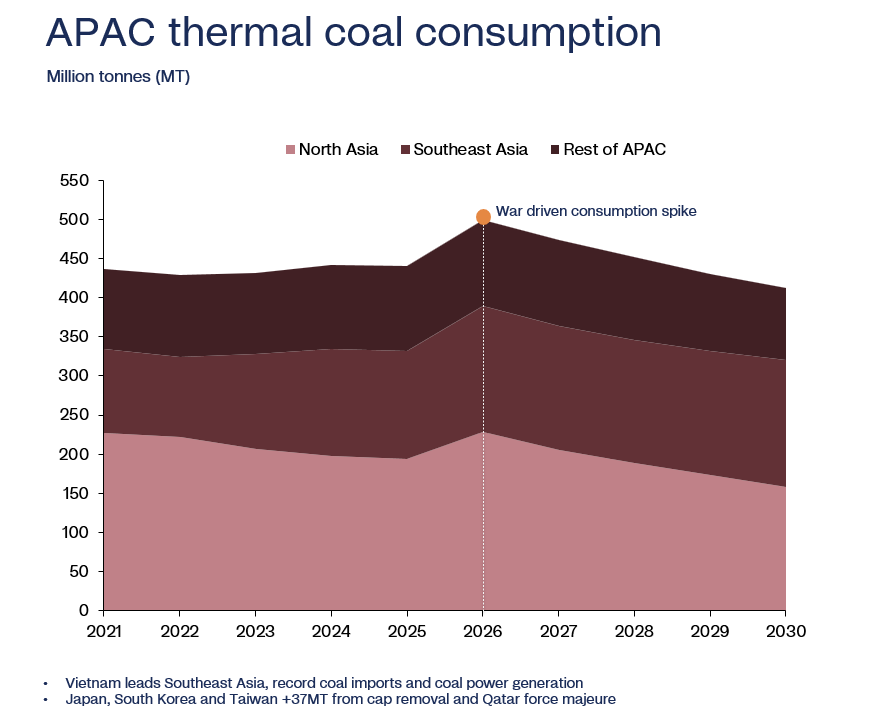
APEC coal demand remains resilient despite accelerating energy transition
July 21, 2026
European grid planners outline future with diminishing role for coal-fired generation
July 21, 2026
Higher LNG prices expected to drive gas-to-coal switching across Asia
July 13, 2026
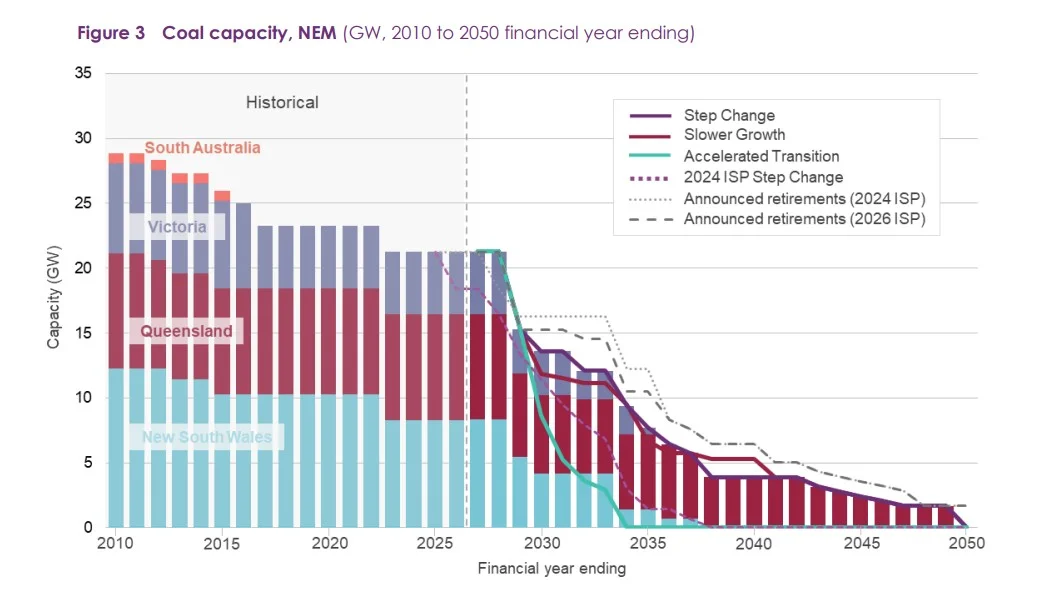
Coal-fired generation in Australia’s energy market
June 30, 2026
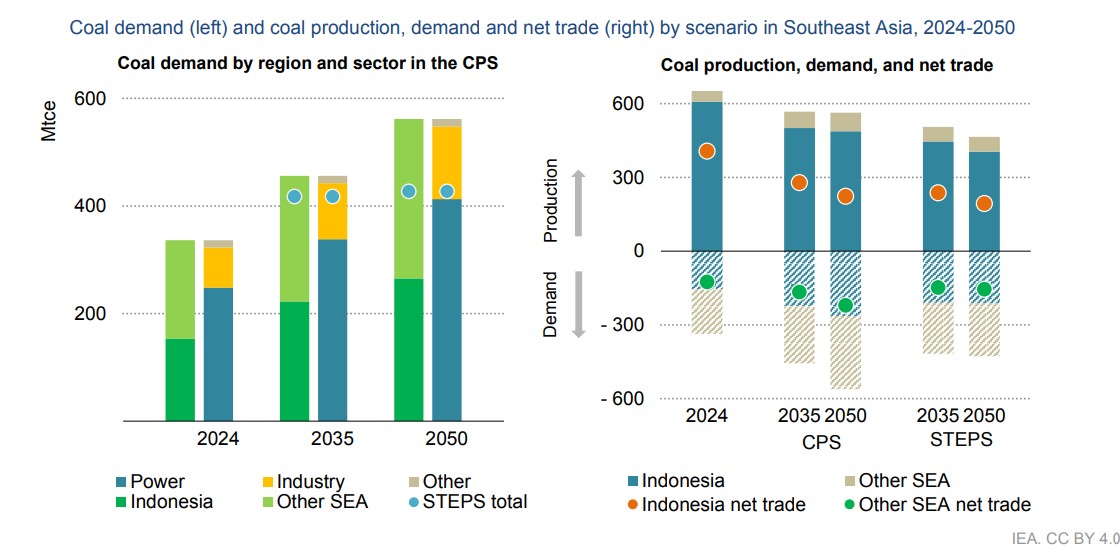
Southeast Asia coal demand remains resilient despite energy transition plans
June 23, 2026
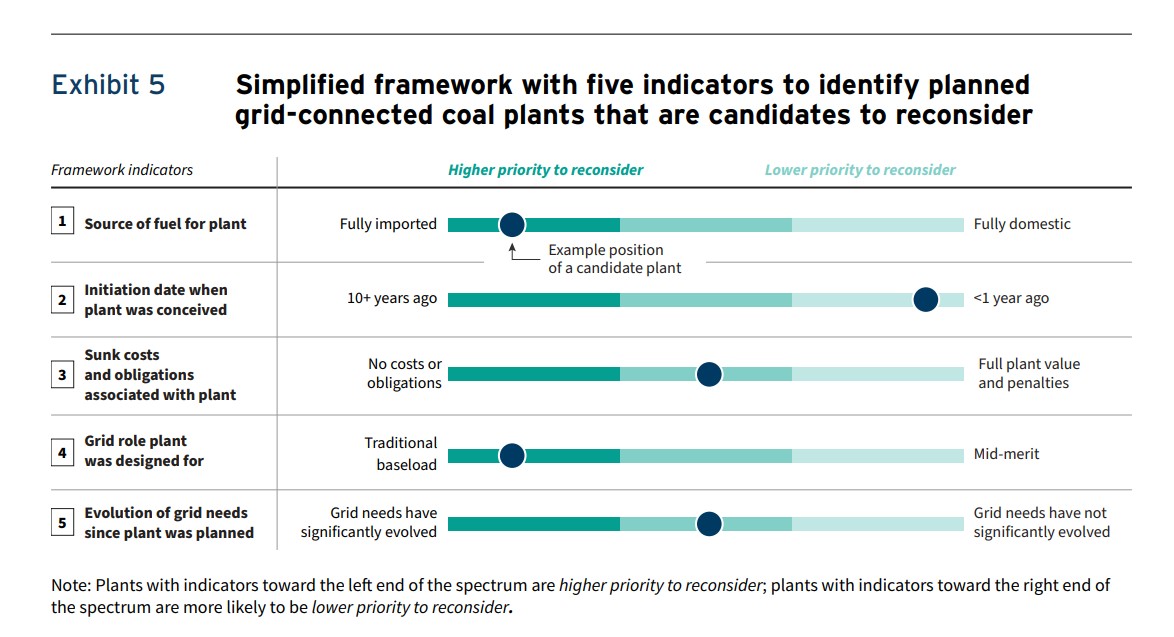
Coal plant value in focus as 640 GW of coal fired generation comes under review
June 9, 2026
Asian coal demand rises as LNG shortages force utilities back to coal
June 8, 2026
Coal fired generation helps Asian economies navigate energy supply shocks
June 8, 2026
Coal power generation returns as LNG crisis tightens global gas markets
May 18, 2026
Previous
Page
1
Page
2
Page
3
…
Page
19
Next
Recent Post
Russian coal exports to Turkey fall 26.9% in January–May 2026
July 20, 2026
Kuzbass coal production falls 3.6% in H1 2026 despite export growth
July 20, 2026
Russian coal industry to return $0.7 billion in tax deferrals amid mounting losses
July 20, 2026
Global coal prices diverge as geopolitical risks support energy markets
July 21, 2026
Trending Posts
Supply disruption lifts China’s Mongolian met coal prices
March 25, 2021
Coal production in Kuzbass down 4.9% in Jan-Apr 2025
May 26, 2025
World coal market – week 47
November 26, 2021
Capesize Freight Rates Rise Higher, Demand Strong
July 10, 2020