Skip to content
Search
X-twitter
Linkedin
Youtube
Home
Premium Content
Insights
Events
Industry Links
Coal Consultants
Coal Industry Association
Coal Industry News
Coal Price & Market Information
Government Organisation
Think Tank
Coal Company
About Us
Other Hubs
EUROPEAN GAS HUB
GLOBAL LNG HUB
GLOBAL MARITIME HUB
GLOBAL HYDROGEN HUB
GLOBAL MINERALS HUB
FREE TRIAL
My account
Login
€
0.00
0
Cart
€
0.00
0
Cart
Search
Home
Premium Content
Insights
Events
Industry Links
Coal Consultants
Coal Industry Association
Coal Industry News
Coal Price & Market Information
Government Organisation
Think Tank
Coal Company
About Us
Other Hubs
EUROPEAN GAS HUB
GLOBAL LNG HUB
GLOBAL MARITIME HUB
GLOBAL HYDROGEN HUB
GLOBAL MINERALS HUB
FREE TRIAL
My account
Login
X-twitter
Linkedin
Youtube
© 2025 TheCoalHub | All Rights Reserved
Tag: energy transition
APEC coal demand remains resilient despite accelerating energy transition
July 21, 2026
Global coal demand remains resilient despite the energy transition
June 30, 2026
Coal mine closures have lasting economic impact across U.S. Appalachia
June 30, 2026
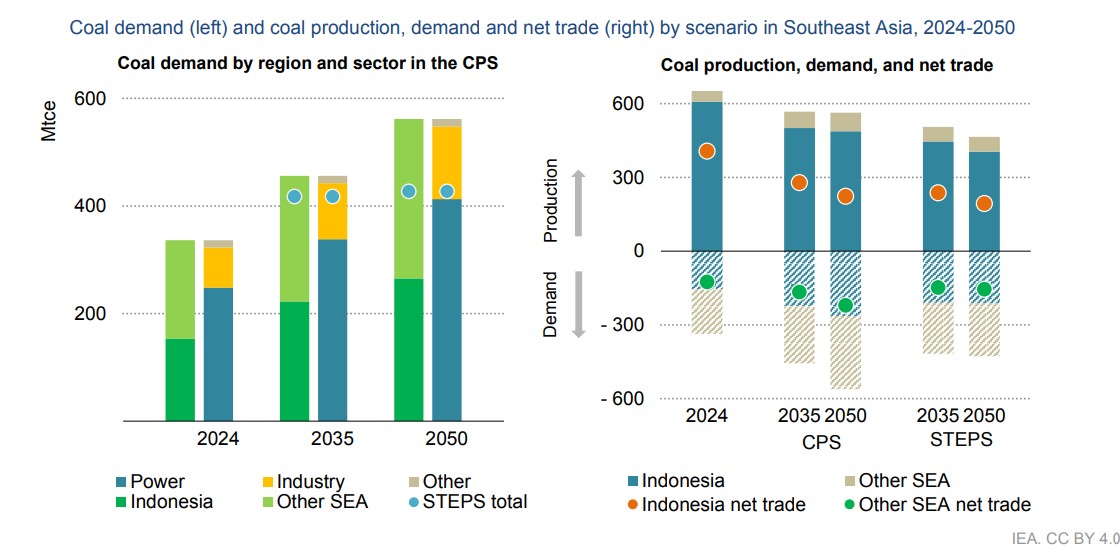
Southeast Asia coal demand remains resilient despite energy transition plans
June 23, 2026
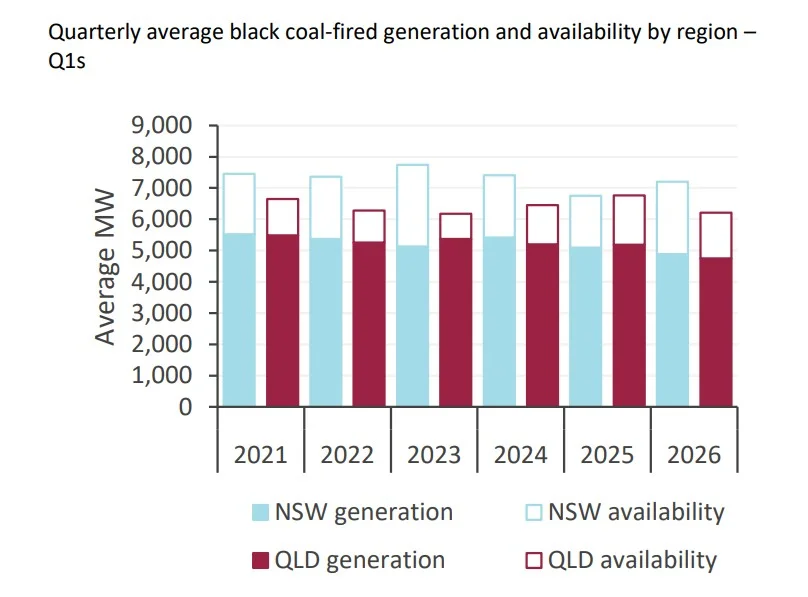
Australian coal generation holds in evolving power market dynamics
May 12, 2026
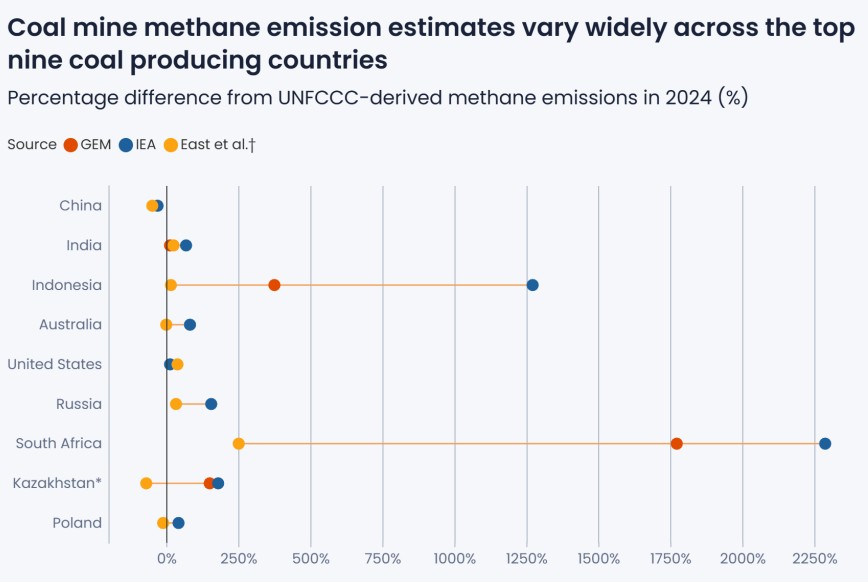
Global coal mine methane emissions remain high as reporting gaps mask true scale
May 4, 2026
Coal fired power under pressure from renewables as demand persists in Asia
April 28, 2026
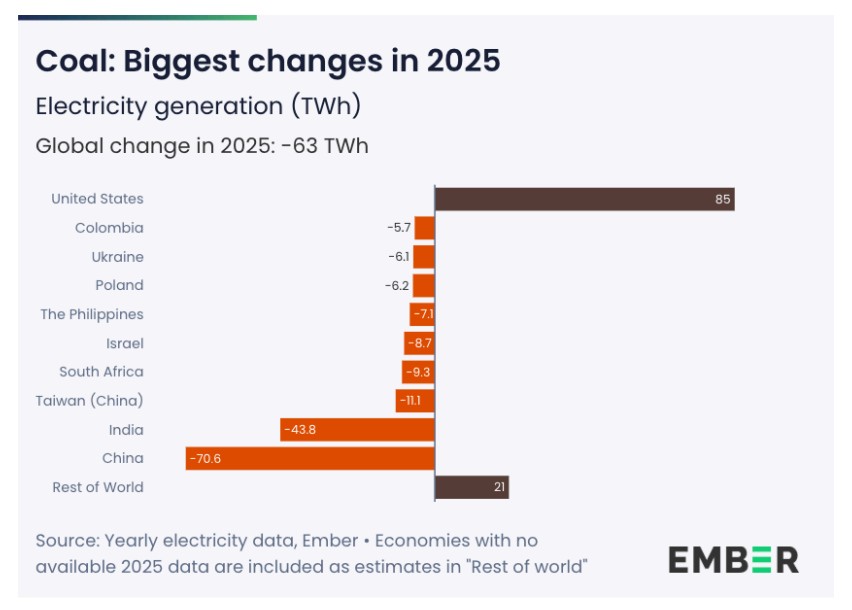
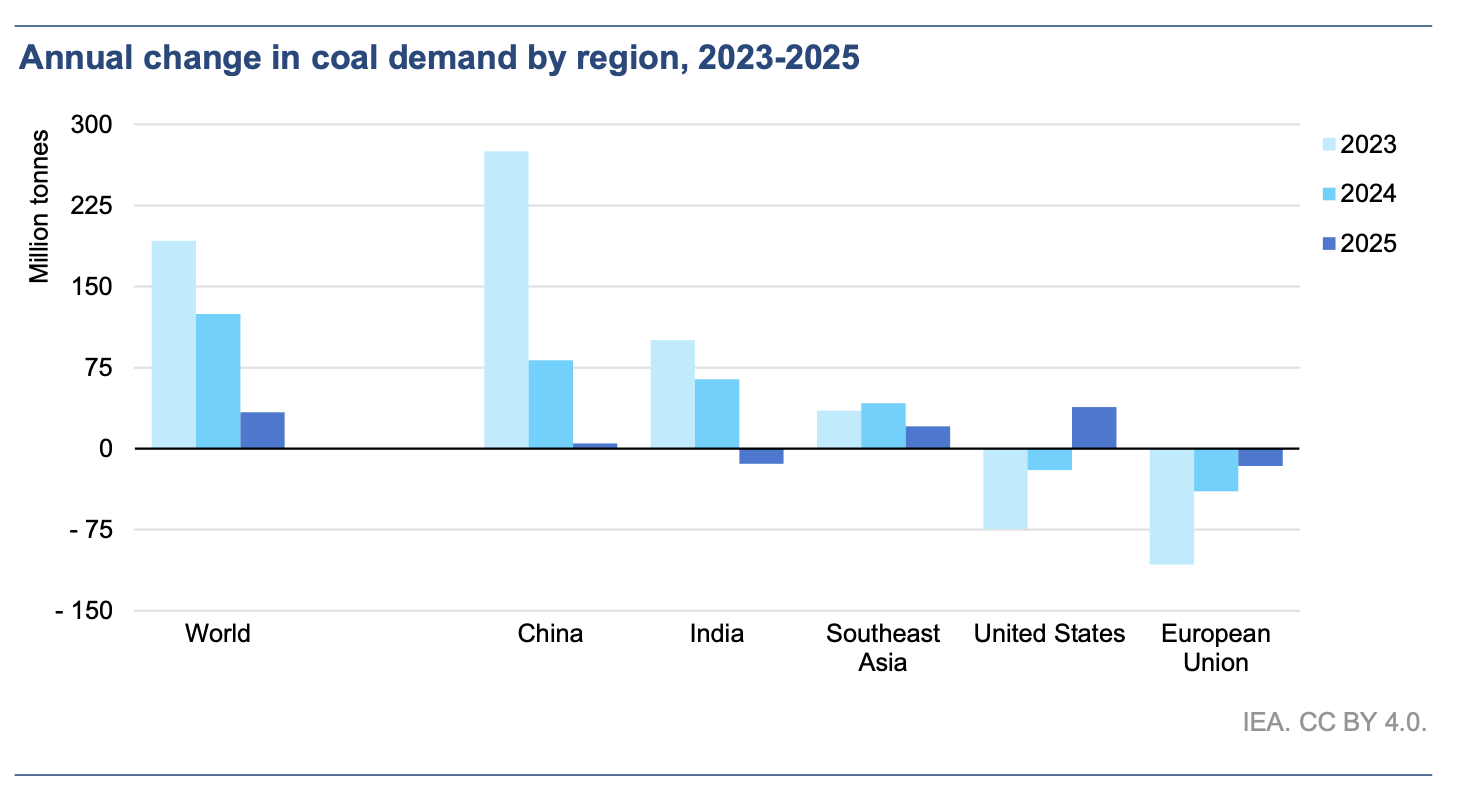
Global coal demand stabilises as power markets undergo structural shift
April 27, 2026
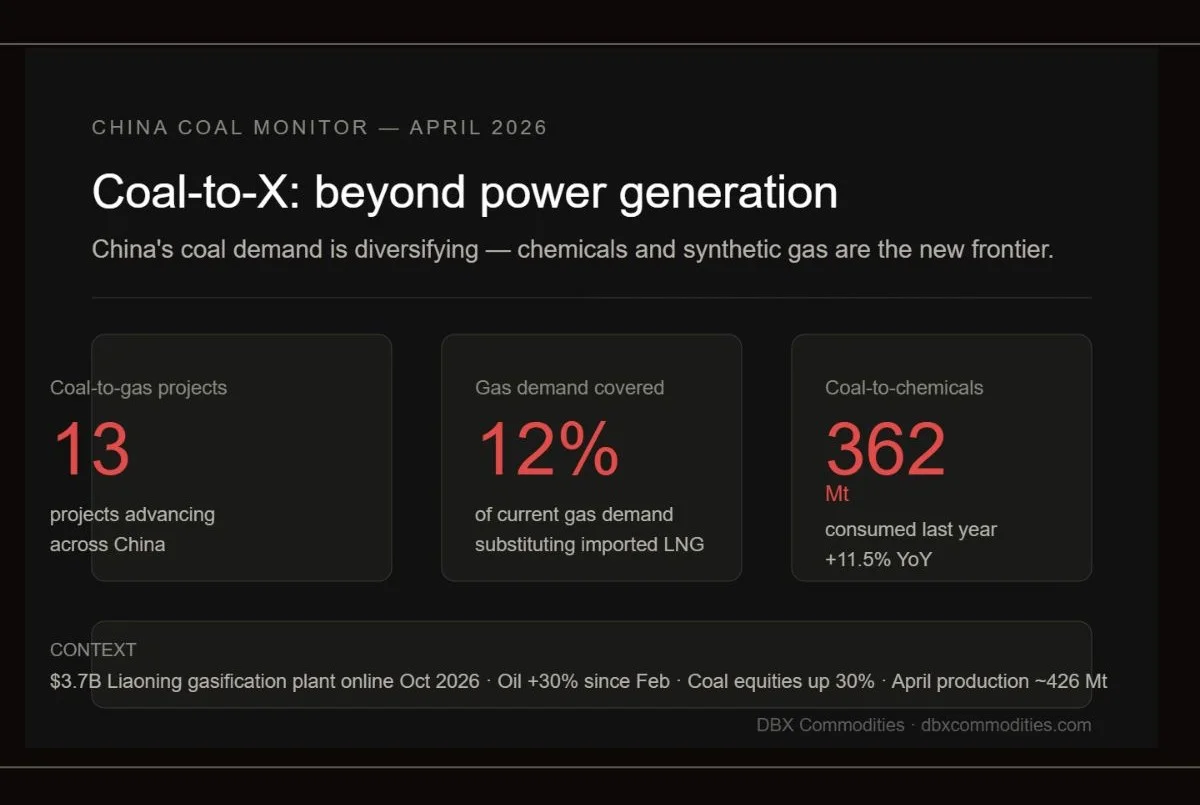
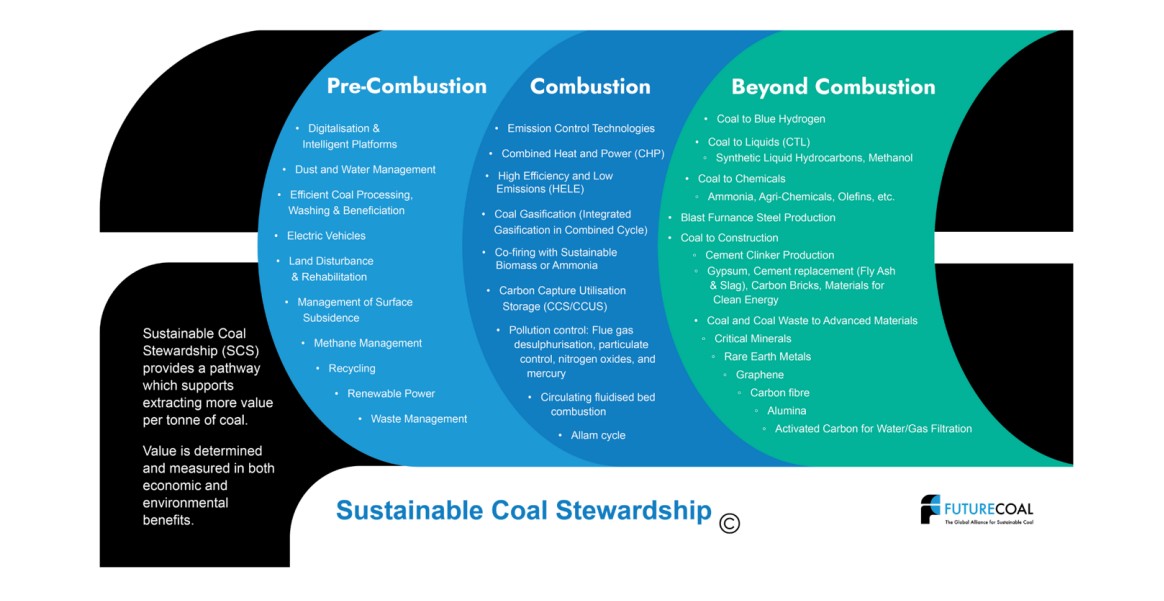
China coal-to-X transformation: how coal is expanding beyond power generation
April 27, 2026
Coal blind spots in energy security and transition policy
April 27, 2026
Previous
Page
1
Page
2
Page
3
…
Page
10
Next
Recent Post
Kazakh coal transit through Russian ports rises 34% in H1 2026
July 27, 2026
Russian coal exports face 12 million tonne risk from Black Sea attacks
July 27, 2026
Global coal prices rise amid geopolitical tensions and stronger summer demand
July 27, 2026
China coal power rises for sixth consecutive month
July 21, 2026
Trending Posts
Kuzbass coal production drops 2.3%, exports down 15.5% in Jan 2024
February 23, 2024
Global coal market: prices and demand remain subdued
December 8, 2024
Ukraine’s coal imports down 67% in Jan-Aug 2022
October 14, 2022
Coal production in Kuzbass down 4.9% in Jan-Apr 2025
May 26, 2025