Skip to content
Search
X-twitter
Linkedin
Youtube
Home
Premium Content
Insights
Events
Industry Links
Coal Consultants
Coal Industry Association
Coal Industry News
Coal Price & Market Information
Government Organisation
Think Tank
Coal Company
About Us
Other Hubs
EUROPEAN GAS HUB
GLOBAL LNG HUB
GLOBAL MARITIME HUB
GLOBAL HYDROGEN HUB
GLOBAL MINERALS HUB
FREE TRIAL
My account
Login
€
0.00
0
Cart
€
0.00
0
Cart
Search
Home
Premium Content
Insights
Events
Industry Links
Coal Consultants
Coal Industry Association
Coal Industry News
Coal Price & Market Information
Government Organisation
Think Tank
Coal Company
About Us
Other Hubs
EUROPEAN GAS HUB
GLOBAL LNG HUB
GLOBAL MARITIME HUB
GLOBAL HYDROGEN HUB
GLOBAL MINERALS HUB
FREE TRIAL
My account
Login
X-twitter
Linkedin
Youtube
© 2025 TheCoalHub | All Rights Reserved
Archives: Reports & Presentations
Indonesia coal: captive coal-fired power expands with nickel smelting
February 23, 2026
India coal imports open 2026 with steady January trade flows
February 23, 2026
India petcoke imports hold firm in 2025 amid cement sector demand
February 23, 2026
India coal imports dip in 2025 as domestic supply improves
February 20, 2026
Global coal prices firm as supply tightness offsets uneven demand
February 16, 2026
Clean coal technology and the indispensable role of coal in ASEAN energy
February 16, 2026
U.S. coal market tightens as consumption rises and exports slip
February 16, 2026
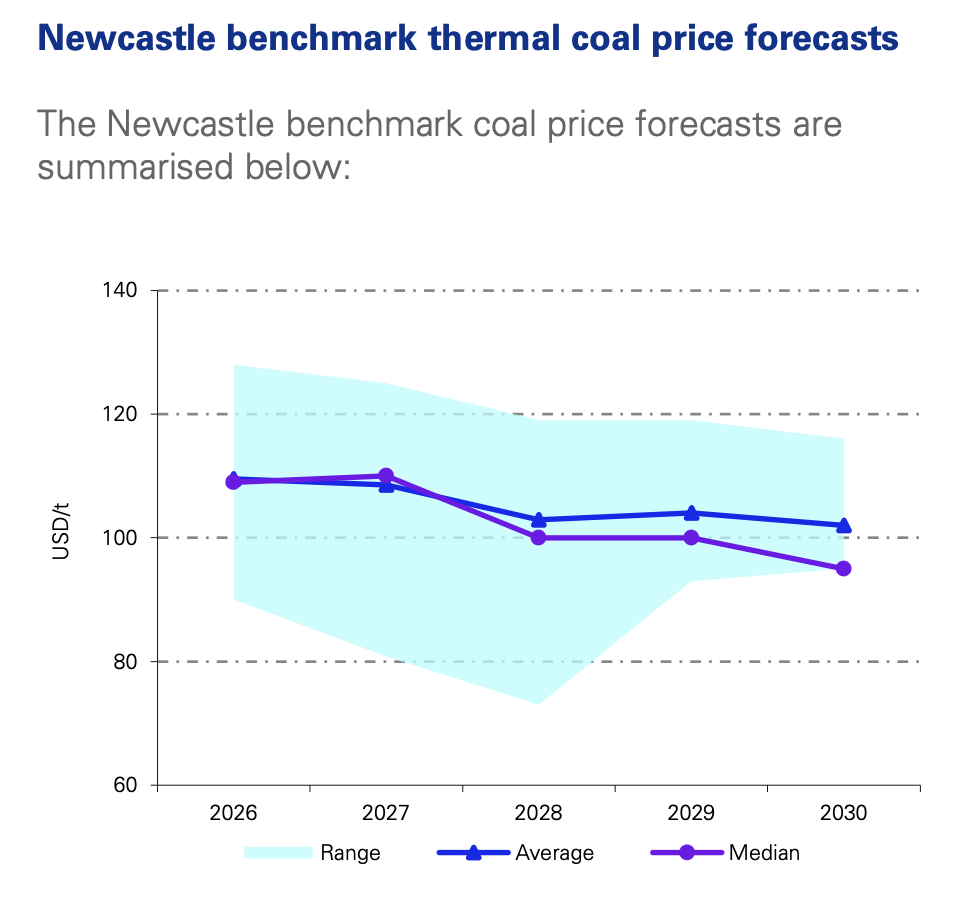
Coal prices to remain elevated before gradual long-term easing
February 16, 2026
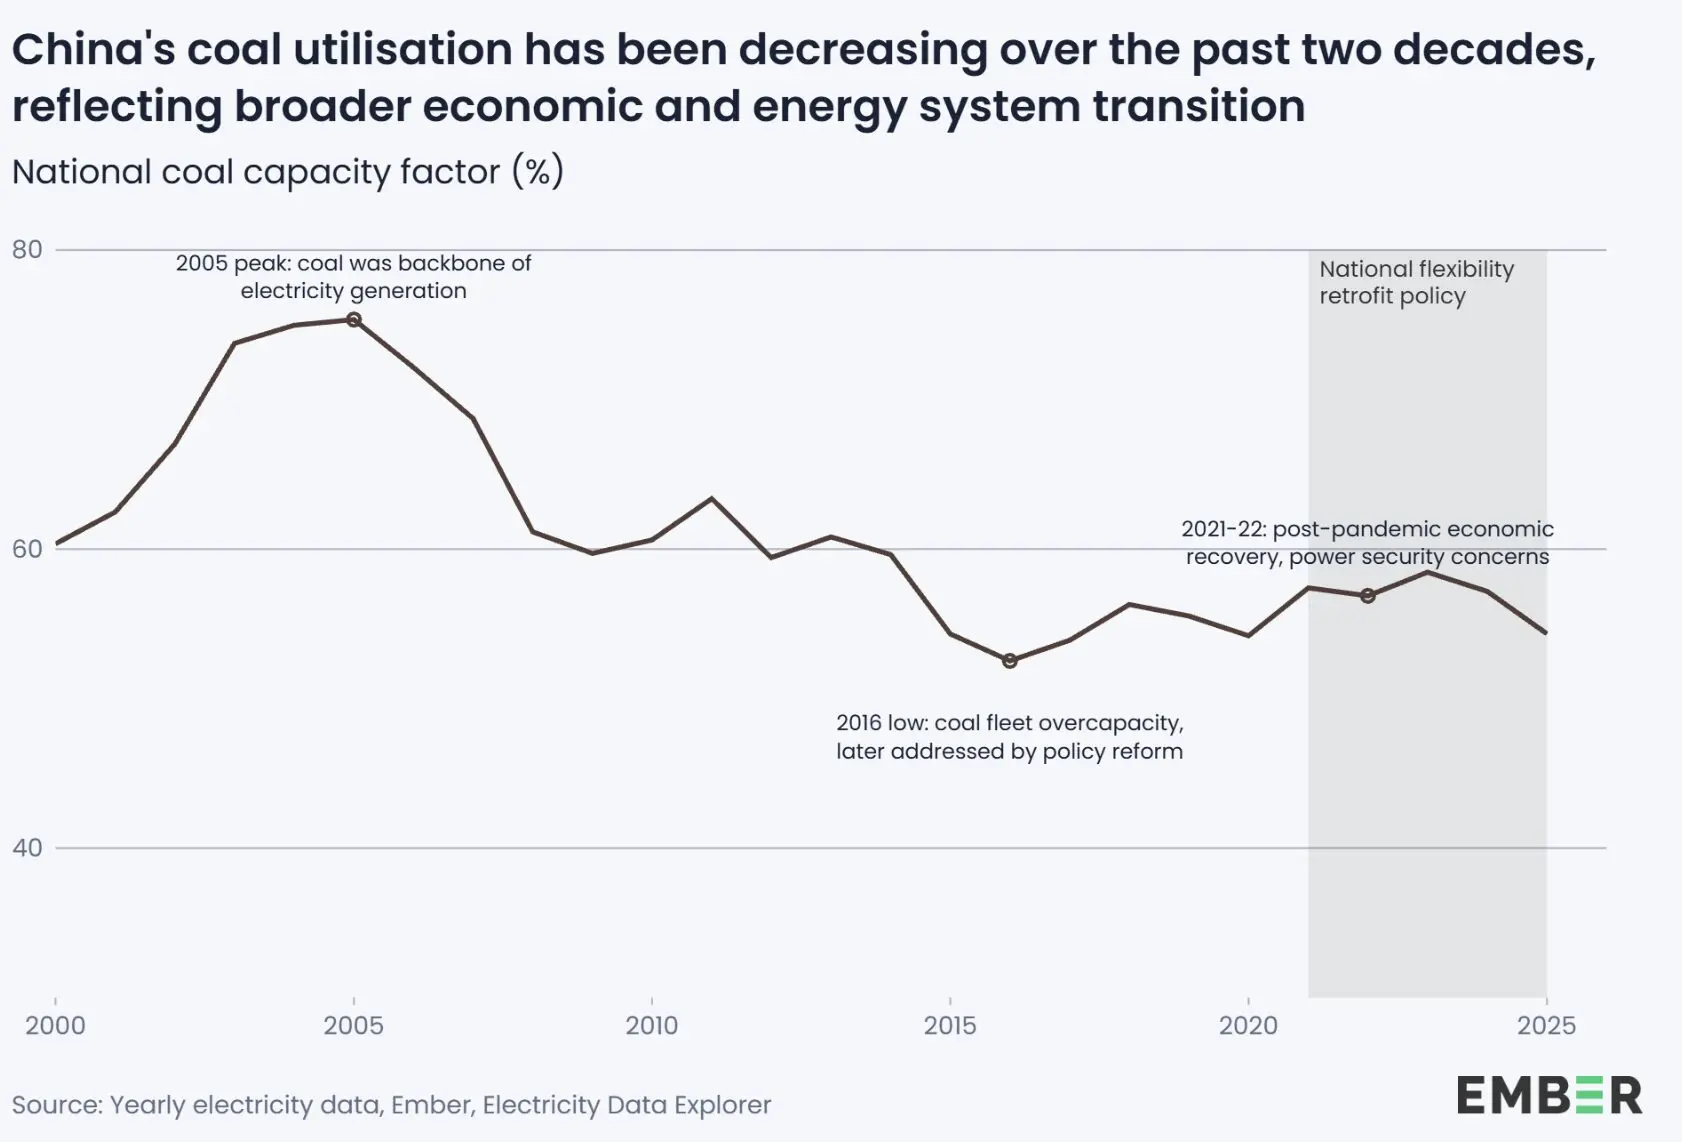
China shifts coal-fired power from baseload to flexibility
February 16, 2026
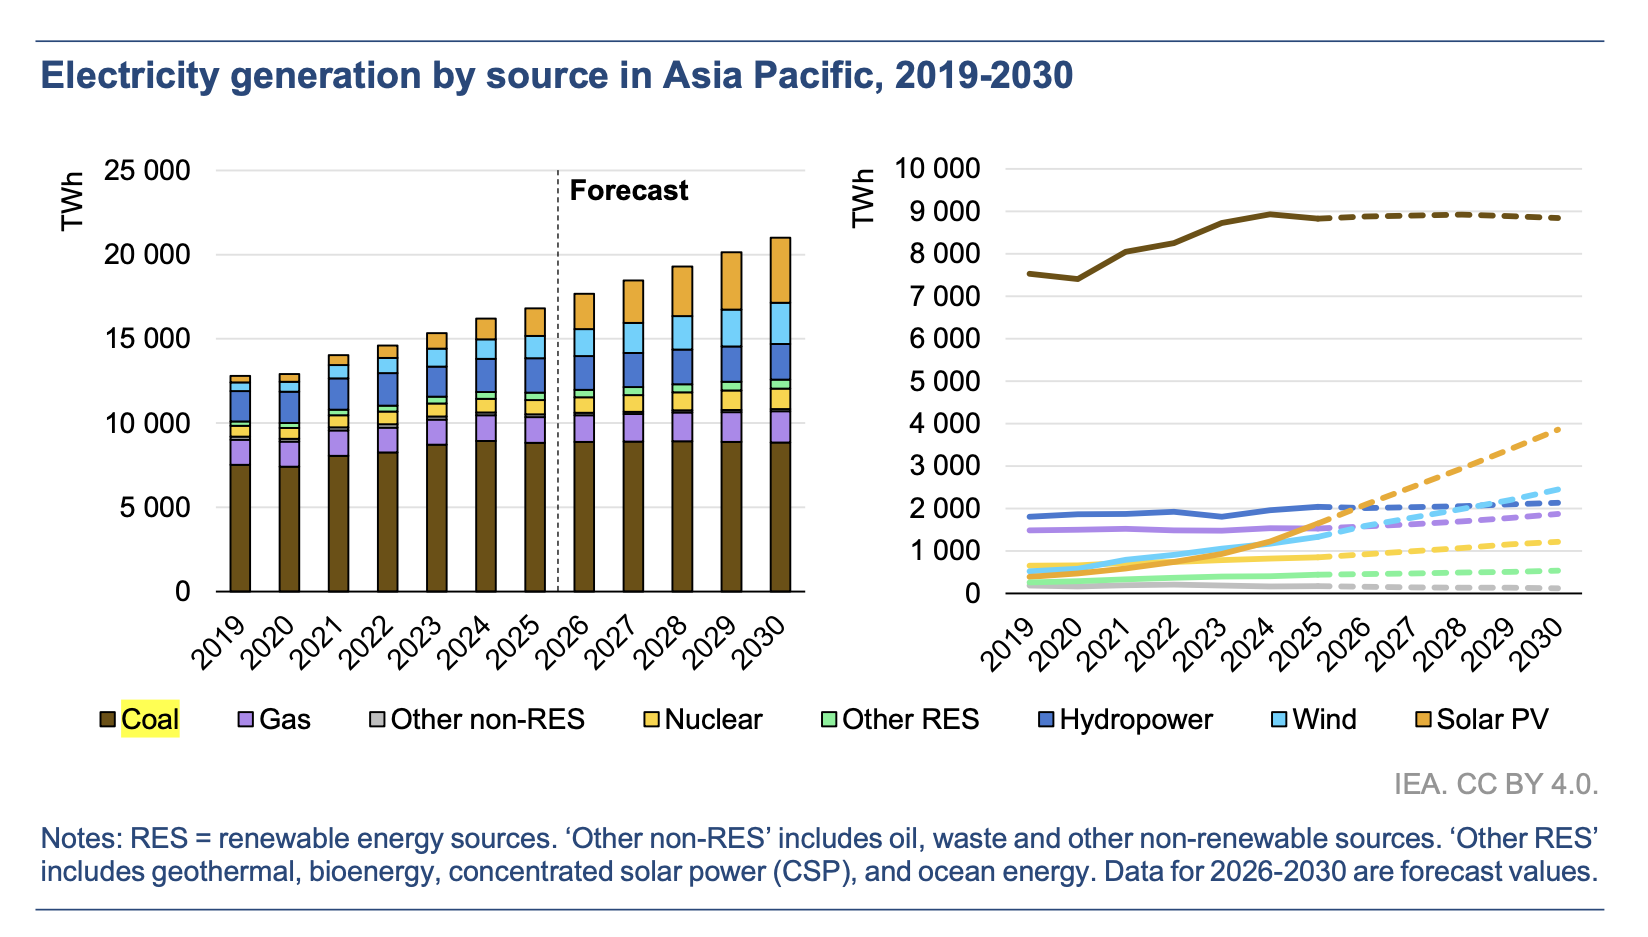
Global electricity demand growth: peak coal does not mean irrelevant coal
February 9, 2026
Previous
Page
1
…
Page
8
Page
9
Page
10
Page
11
Page
12
…
Page
206
Next
Recent Post
South Asian coal demand supports stronger seaborne flows
June 15, 2026
Met coal market volatility rises as China supply concerns unsettle trade
June 15, 2026
Asian coal demand rises as LNG shortages force utilities back to coal
June 8, 2026
Russian coal companies face rising losses in Q1 2026
June 6, 2026
Trending Posts
Rail tariffs grow at outstripping rate
May 20, 2023
World coal market: brief overview
March 1, 2025
World coal market: brief overview
February 17, 2023
World coal market: brief overview
September 23, 2022