Skip to content
Search
X-twitter
Linkedin
Youtube
Home
Premium Content
Insights
Events
Industry Links
Coal Consultants
Coal Industry Association
Coal Industry News
Coal Price & Market Information
Government Organisation
Think Tank
Coal Company
About Us
Other Hubs
EUROPEAN GAS HUB
GLOBAL LNG HUB
GLOBAL MARITIME HUB
GLOBAL HYDROGEN HUB
GLOBAL MINERALS HUB
FREE TRIAL
My account
Login
€
0.00
0
Cart
€
0.00
0
Cart
Search
Home
Premium Content
Insights
Events
Industry Links
Coal Consultants
Coal Industry Association
Coal Industry News
Coal Price & Market Information
Government Organisation
Think Tank
Coal Company
About Us
Other Hubs
EUROPEAN GAS HUB
GLOBAL LNG HUB
GLOBAL MARITIME HUB
GLOBAL HYDROGEN HUB
GLOBAL MINERALS HUB
FREE TRIAL
My account
Login
X-twitter
Linkedin
Youtube
© 2025 TheCoalHub | All Rights Reserved
Tag: coal-fired power
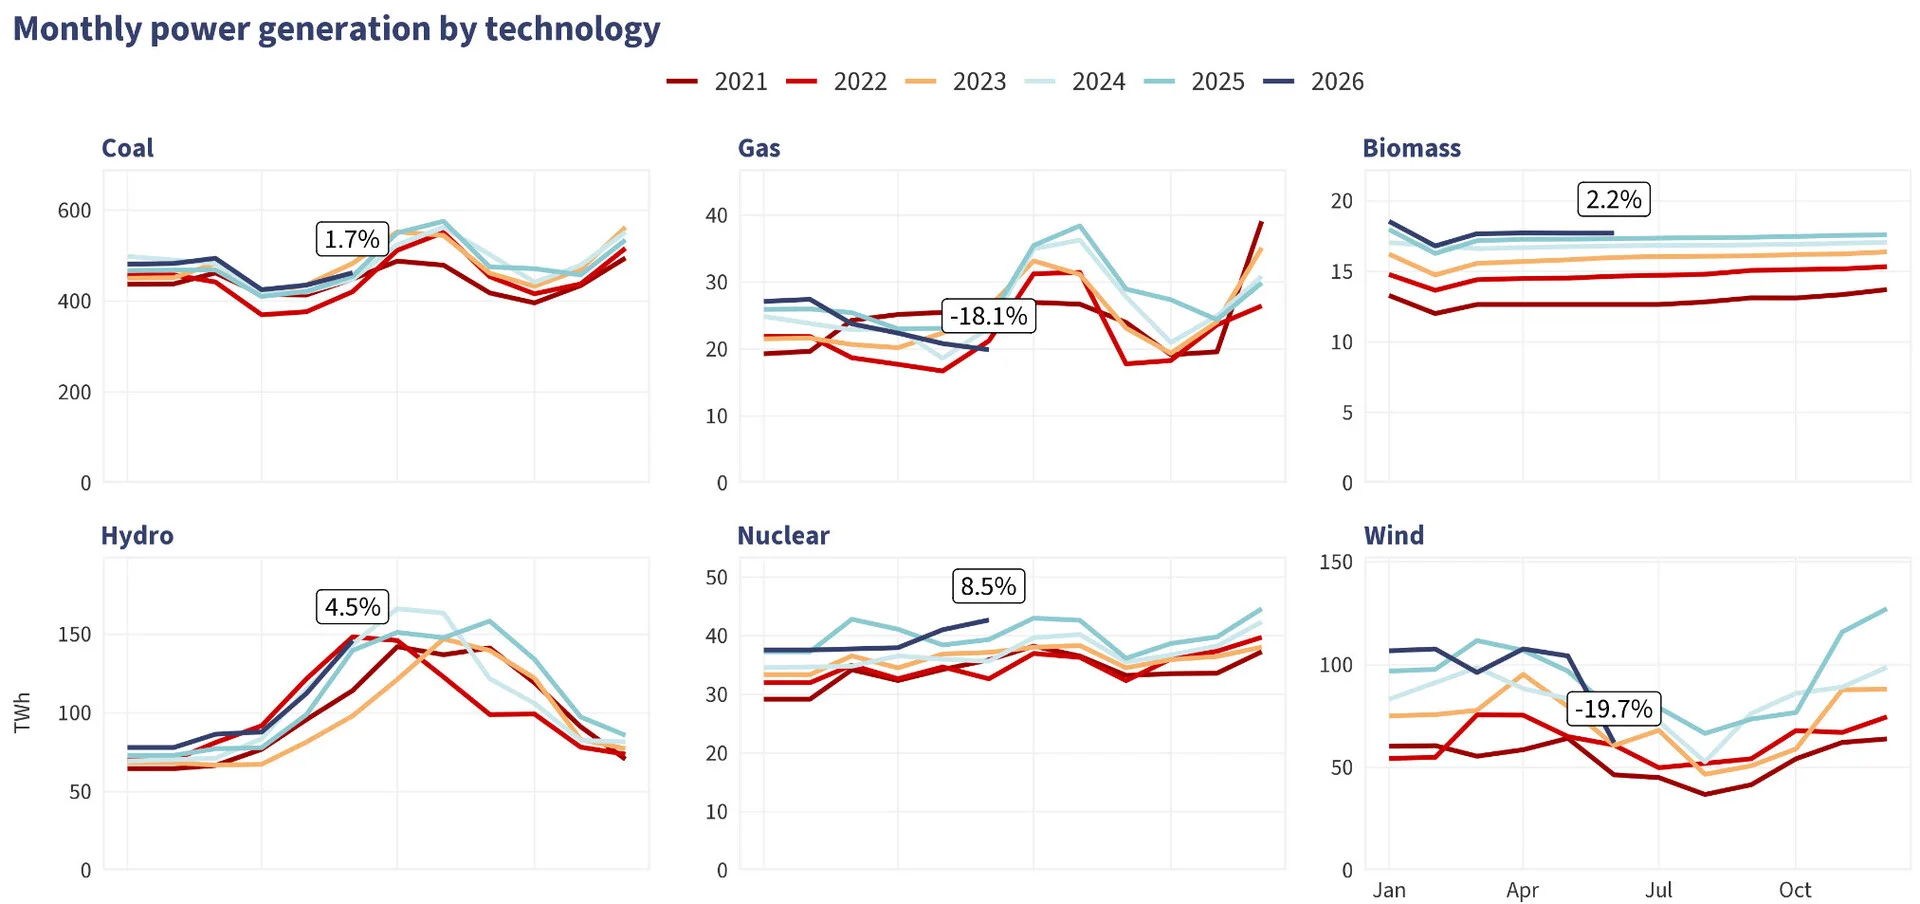
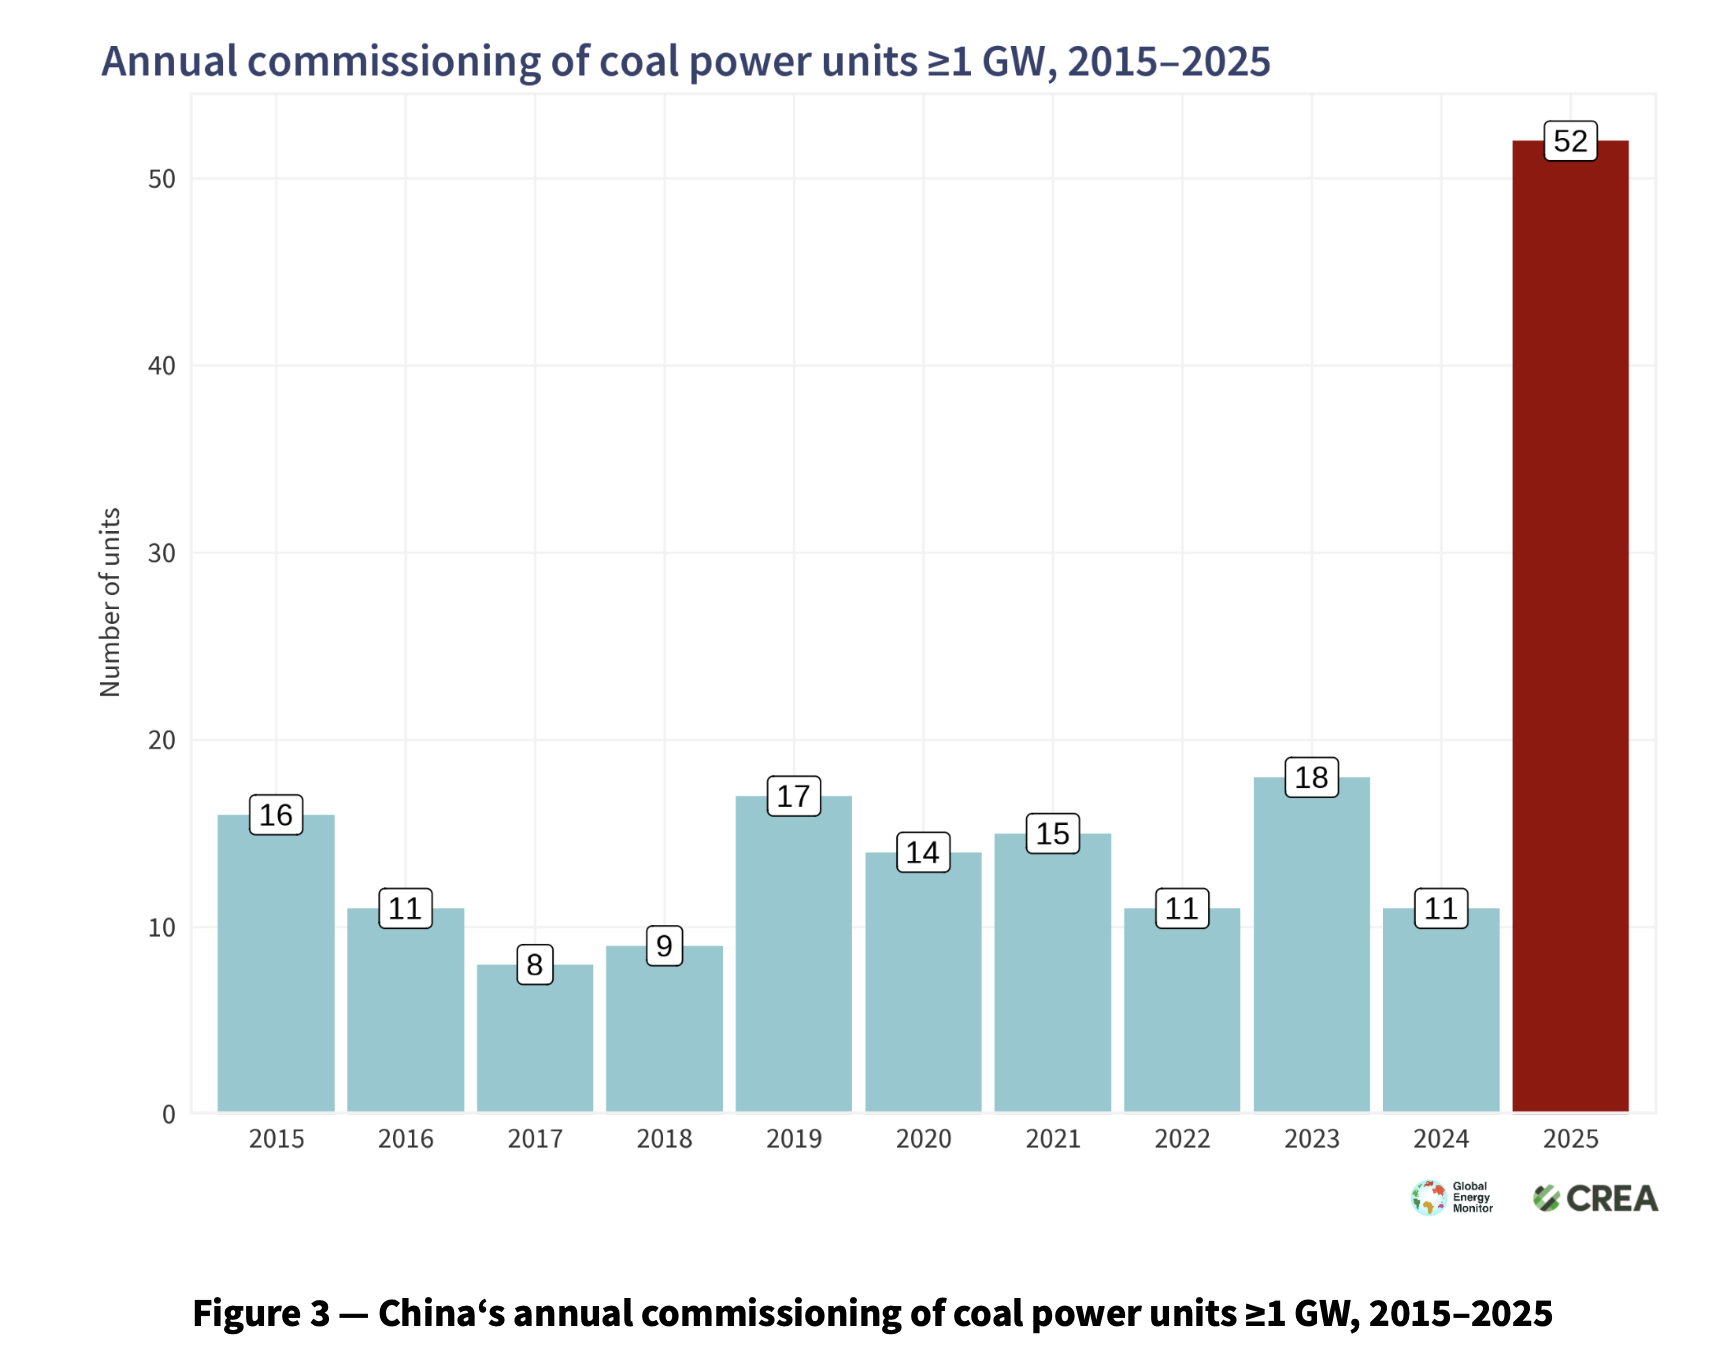
China coal: New report questions whether renewables can displace fossil fuels
July 24, 2026
EU Emissions Trading System review could reshape gas-fired generation economics across Europe
July 13, 2026
Power generation costs and the changing competitive landscape for coal-fired power
July 7, 2026
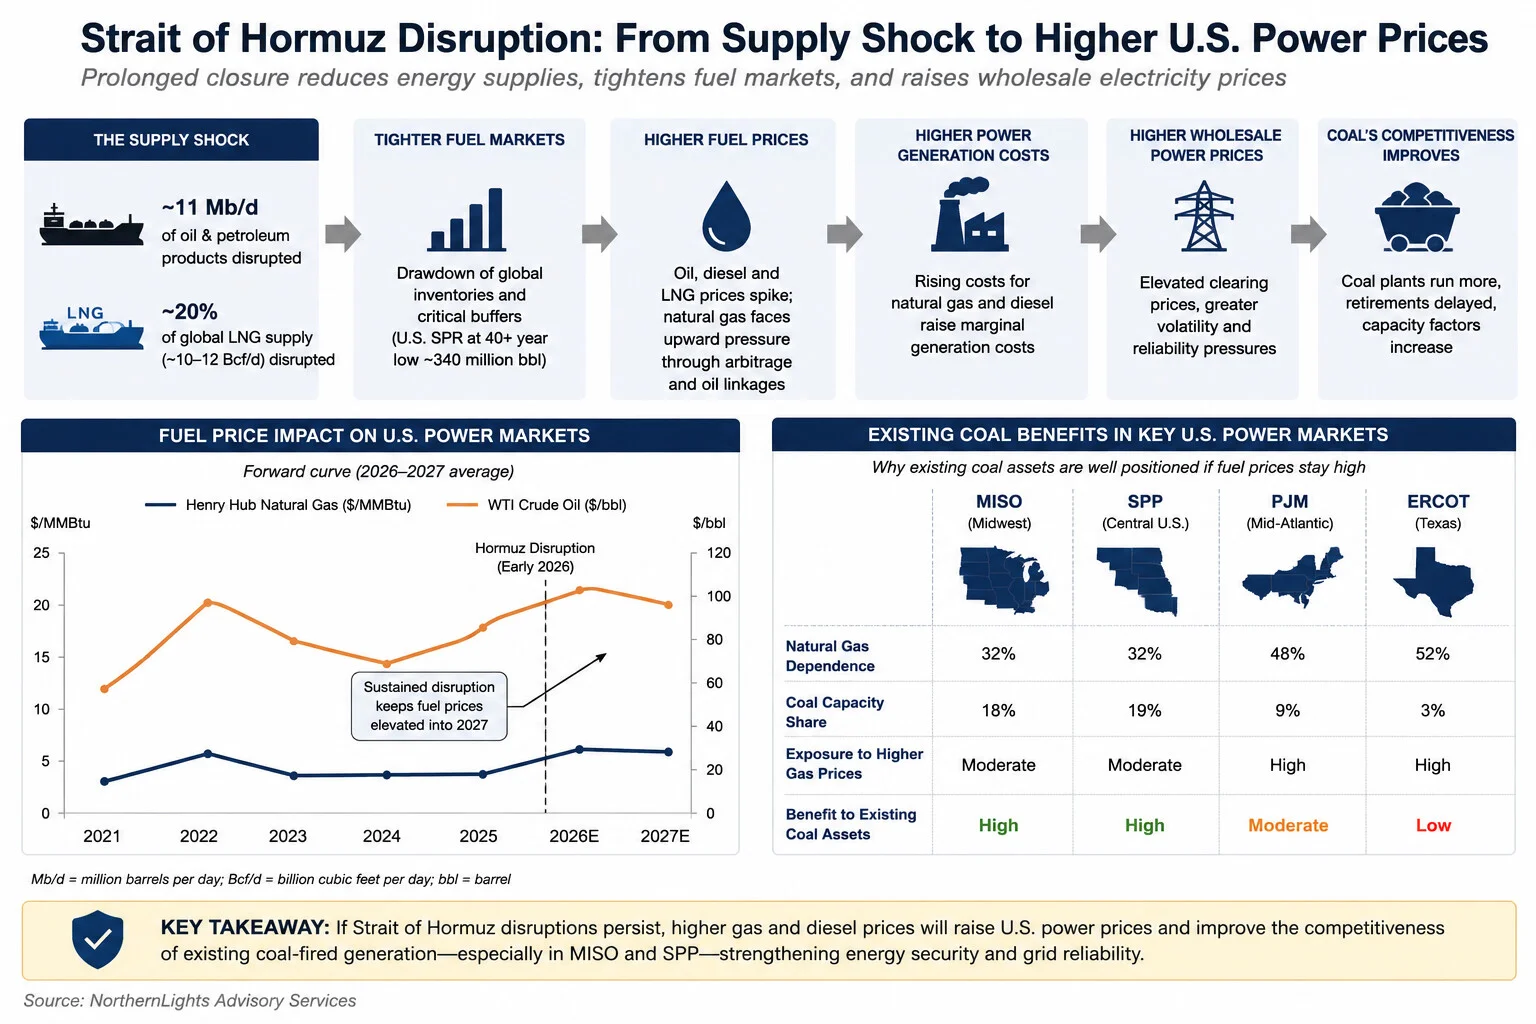
US coal-fired generation could benefit from prolonged energy market disruption
June 30, 2026
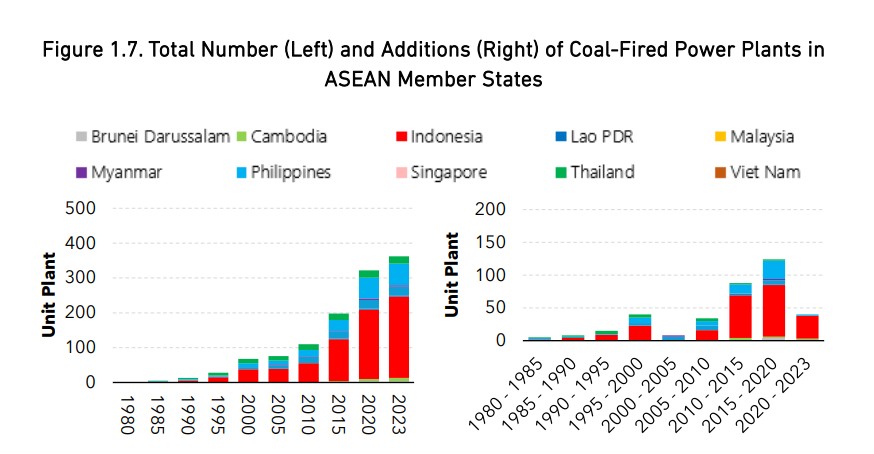
ASEAN coal strategies for a changing energy landscape
June 30, 2026
AI-driven power demand boosts coal power generation economics in US capacity markets
May 18, 2026
Japan coal demand remains resilient as coal-fired power retains major role in 2030 energy mix
May 12, 2026
China coal demand gains as Hormuz crisis reinforces energy security concerns
May 12, 2026
Australian coal generation holds in evolving power market dynamics
May 12, 2026
Coal fired power under pressure from renewables as demand persists in Asia
April 28, 2026
Previous
Page
1
Page
2
Page
3
…
Page
16
Next
Recent Post
China coal power rises for sixth consecutive month
July 21, 2026
Russian coal exports to Turkey fall 26.9% in January–May 2026
July 20, 2026
Kuzbass coal production falls 3.6% in H1 2026 despite export growth
July 20, 2026
Russian coal industry to return $0.7 billion in tax deferrals amid mounting losses
July 20, 2026
Trending Posts
Global coal prices rise on stronger European, Chinese and Australian markets
May 30, 2026
World coal market: brief overview
October 14, 2022
Global coal market trends diverge across regions this week
November 17, 2025
NDRC: China’s thermal coal consumption falls from peak
August 27, 2021