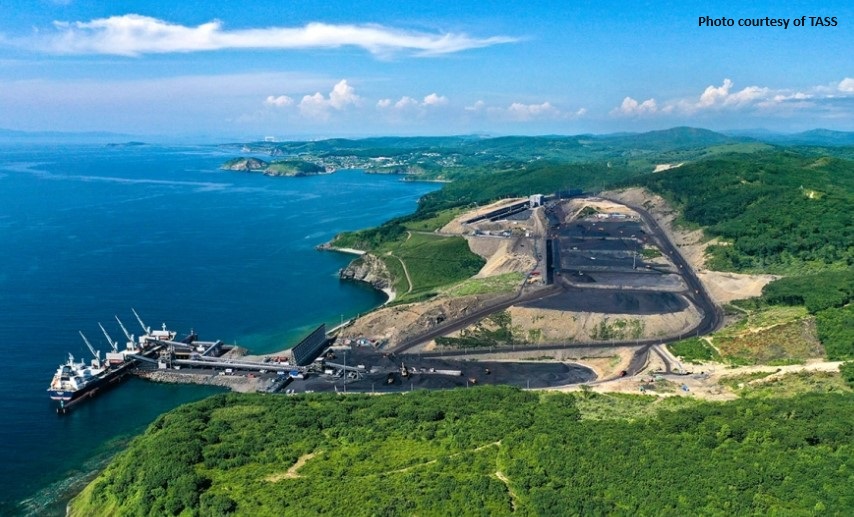
Skip to content
X-twitter Linkedin Youtube
  • Home
  • Premium Content
  • Insights
  • Events
  • Industry Links
    • Coal Consultants
    • Coal Industry Association
    • Coal Industry News
    • Coal Price & Market Information
    • Government Organisation
    • Think Tank
    • Coal Company
  • Other Hubs
    • EUROPEAN GAS HUB
    • GLOBAL LNG HUB
    • GLOBAL MARITIME HUB
    • GLOBAL HYDROGEN HUB
    • GLOBAL MINERALS HUB
  • FREE TRIAL
  • My account
  • Login
€0.00 0 Cart
€0.00 0 Cart
  • Home
  • Premium Content
  • Insights
  • Events
  • Industry Links
    • Coal Consultants
    • Coal Industry Association
    • Coal Industry News
    • Coal Price & Market Information
    • Government Organisation
    • Think Tank
    • Coal Company
  • Other Hubs
    • EUROPEAN GAS HUB
    • GLOBAL LNG HUB
    • GLOBAL MARITIME HUB
    • GLOBAL HYDROGEN HUB
    • GLOBAL MINERALS HUB
  • FREE TRIAL
  • My account
  • Login
X-twitter Linkedin Youtube

© 2025 TheCoalHub | All Rights Reserved

Tag: EIA

Line chart showing monthly changes in U.S. coal stocks held by the electric power sector, with inventory builds in early 2026 and smaller draws later in the year.

U.S. coal outlook 2026 shows lower power burn and stock builds

  • April 13, 2026
Bar chart showing the top five U.S. coal origin states and destination states in the fourth quarter of 2025, with Wyoming leading origins and Texas leading destinations.

U.S. coal distribution eases in Q4 2025 despite annual growth

  • April 7, 2026
EIA-coal-report

Annual U.S. coal production report

  • October 9, 2023

Quarterly Coal Report – U.S.A.

  • April 8, 2021
energy outlook

Short term energy outlook

  • March 11, 2021
coal market analysis

Quarterly Coal Report – October

  • November 26, 2020
US Coal Consumption

U.S. Power Sector Coal Consumption Down by 30%

  • November 10, 2020

U.S Annual Coal Report

  • October 8, 2020

More Coal was Consumed in Indiana than in all but two U.S. States in 2019

  • October 8, 2020

As U.S. Coal-Fired Capacity and Utilization Decline, Operators Consider Seasonal Operation

  • October 1, 2020
Previous Page1 Page2 Next
Recent Post
Monthly stacked bar chart of global seaborne coal exports by origin (Indonesia, Australia, Russia, South Africa, United States, Other) May 2025–May 2026.

Global coal market repriced on security as China demand strengthens

May 6, 2026
Line chart of Indonesia's monthly thermal coal exports (Mt) showing actual exports as a dark blue line with fluctuations; orange shaded window marks the 2023 stress period, and a pale red curved line projects a thinner buffer into 2026. Annotations note Jun–Sep 2023 at -8.1% YoY (full-year +12.9%), 2024 monthly average around 45.4 Mt, and Q1 2026 at -27% vs Q1 2024 with baseline softening; El Niño Watch 2026 Jun–Sep forecast window is indicated, with a red shaded area toward mid-2026 indicating risk. Source details at bottom.

Indonesia thermal coal bullish into H2 2026 as El Niño tightens supply

May 6, 2026
Bar chart titled 'Weekly coal production overview' showing weekly estimates (around 10,000 thousand short tons) for three dates: April 25, 2026; week ago; and year ago.

US coal production weekly update | Week ending April 25

May 4, 2026
Steel plant with smokestacks at night illustrating China’s industrial demand for coking coal imports

Russian coking coal exports to China showed strong growth in Q1 2026

April 28, 2026
Trending Posts
Coking-coal-exports

Russian coking coal exports hit 2-year low

July 22, 2024
China’s Q1 energy output

NBS: China’s Q1 energy output, consumption recover fast

April 22, 2021
Bulk carrier transporting coal in the global seaborne coal market

Global coal prices diverge as European indices fall and Australian coal rallies

March 16, 2026
Graph showing declining Hunter Valley coal contract volumes and production forecasts

Hunter Valley coal contracts signal structural decline in export volumes

April 20, 2026

The Coal Hub is an online platform for sharing analysis and information about the global coal market  more info

Categories

  • Coal Market Outlook
  • Trade and Prices
  • Met / Coking Coal
  • Coal Fired Generation
  • Coal Regions
  • Climate & Technology
  • Economic Impact
  • Petcoke

Recent Analysis

Global coal market repriced on security as China demand strengthens

Indonesia thermal coal bullish into H2 2026 as El Niño tightens supply

US coal production weekly update | Week ending April 25

Weekly Updates

Sign up to receive our weekly newsletter (each Monday) with new coal market reports, presentations & analysis.

Your subscription could not be saved. Please try again.
Your subscription has been successful.

By signing up, I agree to our TOS and Privacy Policy.

© 2025 TheCoalHub | All Rights Reserved

X-twitter Linkedin Youtube