Skip to content
Search
X-twitter
Linkedin
Youtube
Home
Premium Content
Insights
Events
Industry Links
Coal Consultants
Coal Industry Association
Coal Industry News
Coal Price & Market Information
Government Organisation
Think Tank
Coal Company
About Us
Other Hubs
EUROPEAN GAS HUB
GLOBAL LNG HUB
GLOBAL MARITIME HUB
GLOBAL HYDROGEN HUB
GLOBAL MINERALS HUB
FREE TRIAL
My account
Login
€
0.00
0
Cart
€
0.00
0
Cart
Search
Home
Premium Content
Insights
Events
Industry Links
Coal Consultants
Coal Industry Association
Coal Industry News
Coal Price & Market Information
Government Organisation
Think Tank
Coal Company
About Us
Other Hubs
EUROPEAN GAS HUB
GLOBAL LNG HUB
GLOBAL MARITIME HUB
GLOBAL HYDROGEN HUB
GLOBAL MINERALS HUB
FREE TRIAL
My account
Login
X-twitter
Linkedin
Youtube
© 2025 TheCoalHub | All Rights Reserved
Tag: energy security
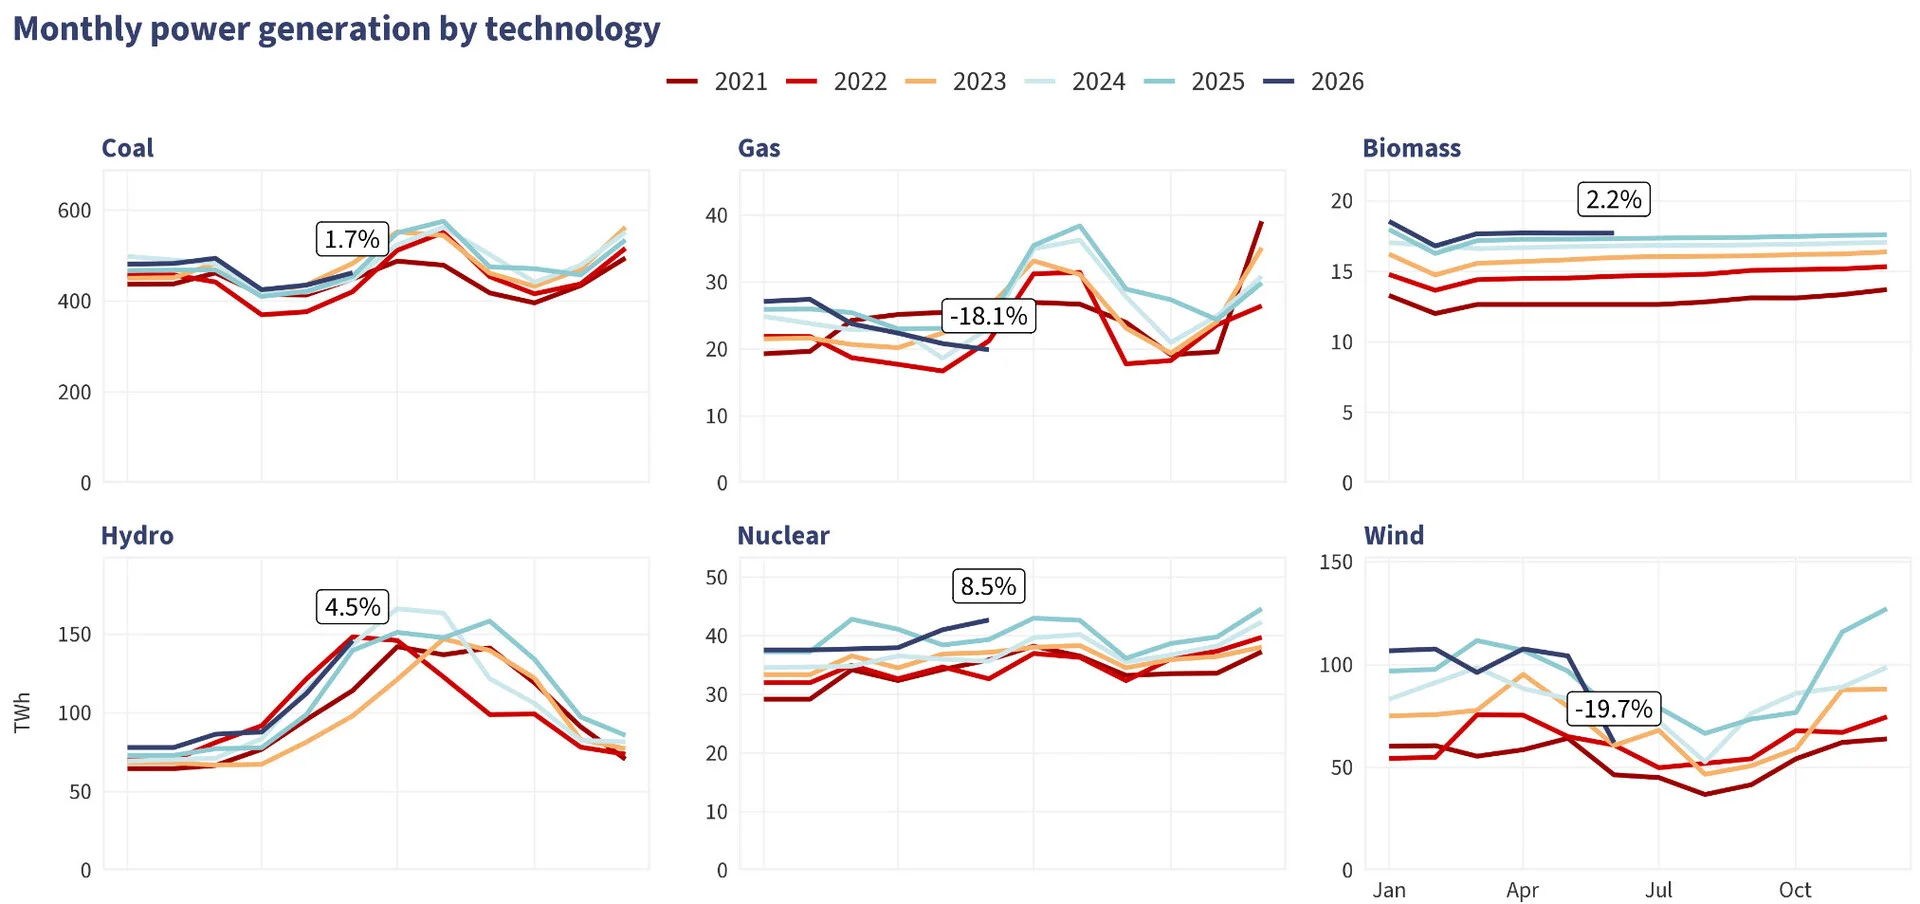
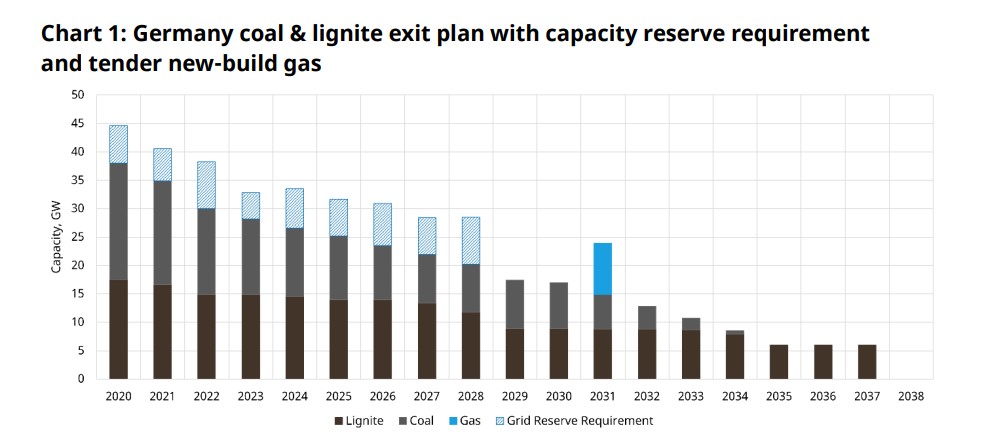
German coal phase-out faces delays in replacement gas capacity
July 21, 2026
Higher LNG prices expected to drive gas-to-coal switching across Asia
July 13, 2026
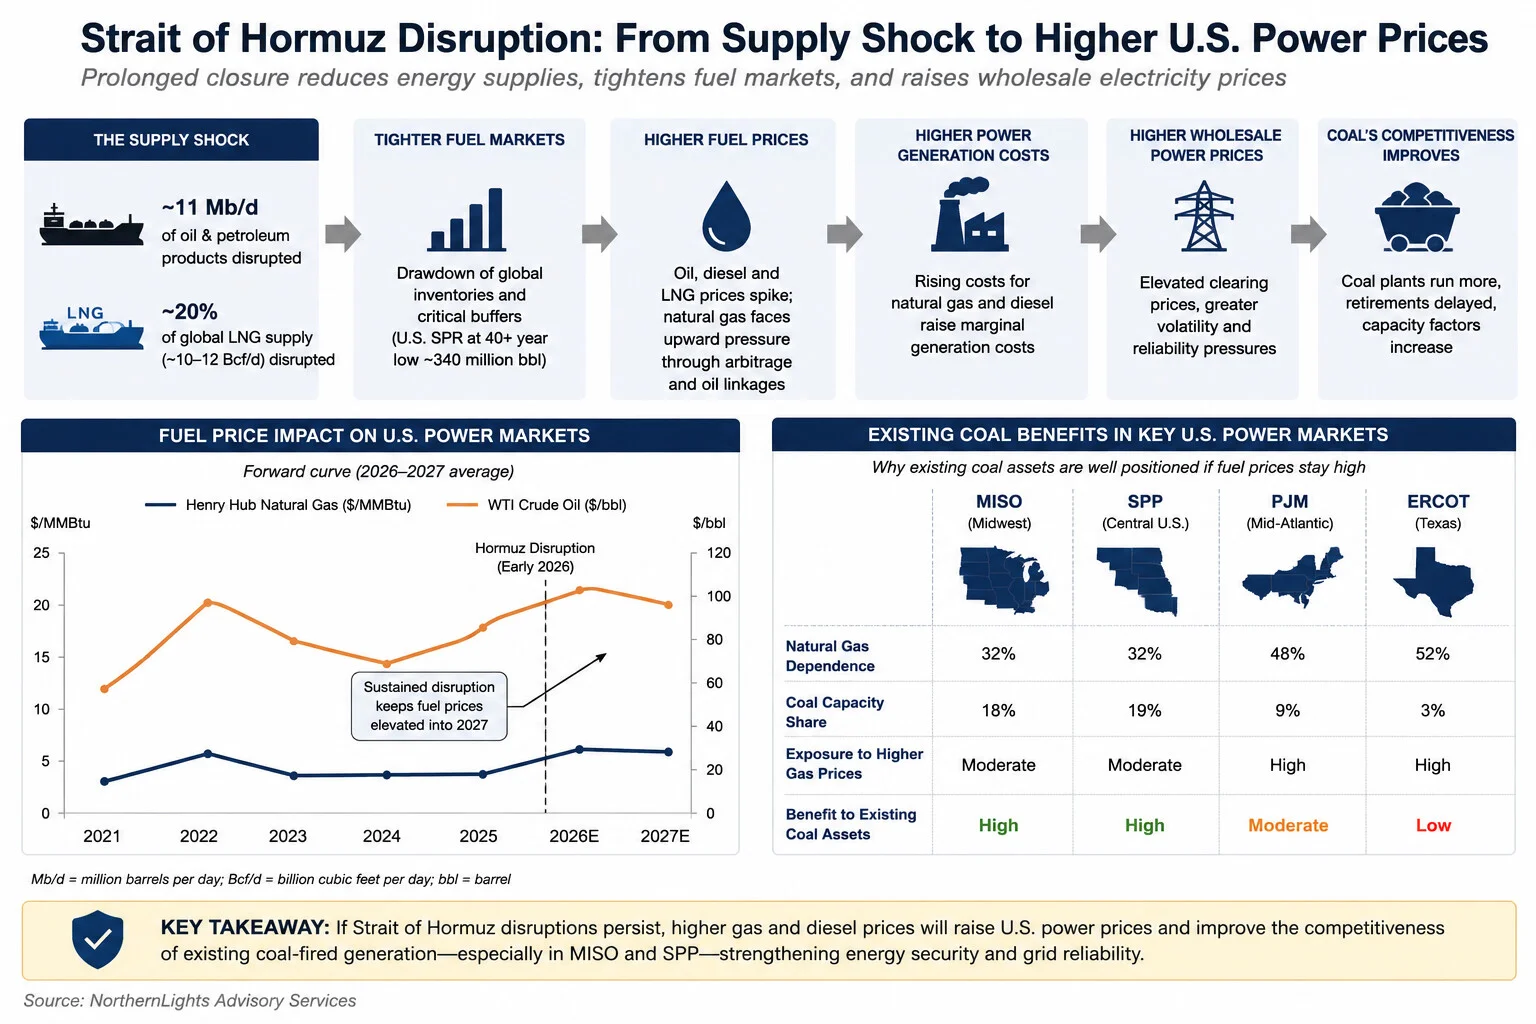
US coal-fired generation could benefit from prolonged energy market disruption
June 30, 2026
Global coal demand remains resilient despite the energy transition
June 30, 2026
US coal fleet modernization gains momentum as reliability concerns grow
June 23, 2026
Southeast Asia coal demand remains resilient despite energy transition plans
June 23, 2026
Coal demand proves resilient as energy security concerns reshape power markets
June 23, 2026
US power reliability concerns grow as demand outpaces new generation
June 23, 2026
Turkish coal imports remain exposed to global energy market disruptions
June 15, 2026
Coal plant value in focus as 640 GW of coal fired generation comes under review
June 9, 2026
Previous
Page
1
Page
2
Page
3
Page
4
Next
Recent Post
China coal power rises for sixth consecutive month
July 21, 2026
Russian coal exports to Turkey fall 26.9% in January–May 2026
July 20, 2026
Kuzbass coal production falls 3.6% in H1 2026 despite export growth
July 20, 2026
Russian coal industry to return $0.7 billion in tax deferrals amid mounting losses
July 20, 2026
Trending Posts
Australia cracks down on coal miners with price cap
January 27, 2023
Rostec receives majority stake in Ogodzhinsky coal deposit and Port Vera
March 2, 2021
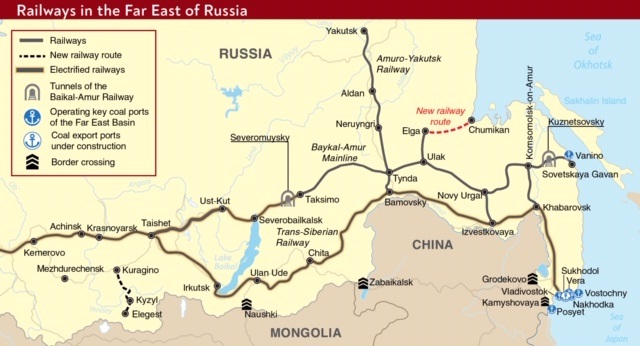
RZD to construct a new railway line connecting Yakutia to ports of Far East
July 9, 2021
World coal market: brief overview
March 2, 2024