Skip to content
Search
X-twitter
Linkedin
Youtube
Home
Premium Content
Insights
Events
Industry Links
Coal Consultants
Coal Industry Association
Coal Industry News
Coal Price & Market Information
Government Organisation
Think Tank
Coal Company
About Us
Other Hubs
EUROPEAN GAS HUB
GLOBAL LNG HUB
GLOBAL MARITIME HUB
GLOBAL HYDROGEN HUB
GLOBAL MINERALS HUB
FREE TRIAL
My account
Login
€
0.00
0
Cart
€
0.00
0
Cart
Search
Home
Premium Content
Insights
Events
Industry Links
Coal Consultants
Coal Industry Association
Coal Industry News
Coal Price & Market Information
Government Organisation
Think Tank
Coal Company
About Us
Other Hubs
EUROPEAN GAS HUB
GLOBAL LNG HUB
GLOBAL MARITIME HUB
GLOBAL HYDROGEN HUB
GLOBAL MINERALS HUB
FREE TRIAL
My account
Login
X-twitter
Linkedin
Youtube
© 2025 TheCoalHub | All Rights Reserved
Tag: Coal demand
Global coal prices firm as freight risks offset weak Asian demand
July 20, 2026
Russian rail coal exports to China plunge 29.5% in January–June 2026
July 13, 2026
Indonesia coal demand set to rise as aluminium expansion drives captive power projects
July 13, 2026
China coal market faces tighter domestic supply ahead of summer
June 30, 2026
Russian coal exports to South Korea nearly doubled in Jan-May 2026
June 29, 2026
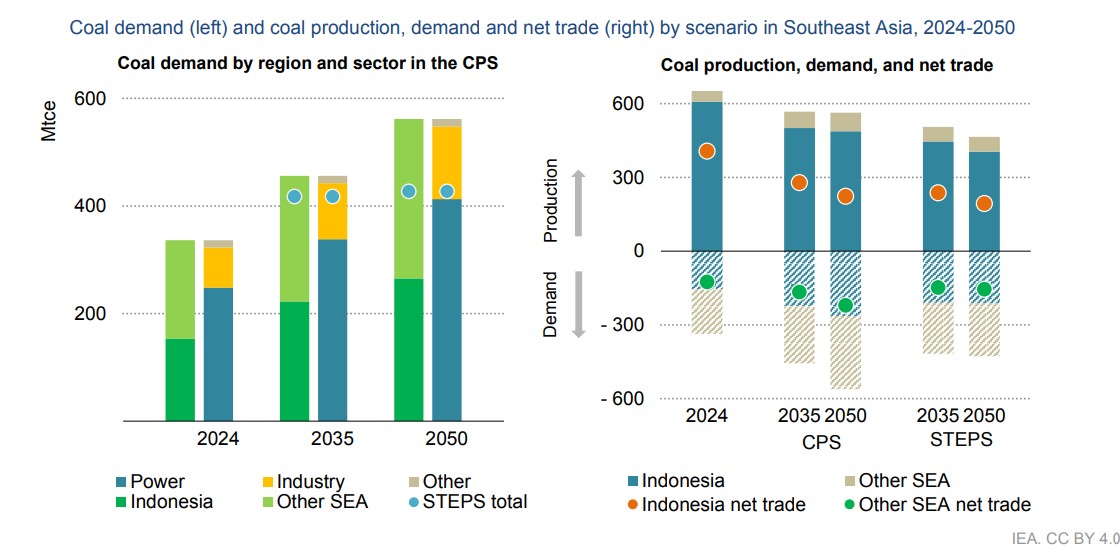
Southeast Asia coal demand remains resilient despite energy transition plans
June 23, 2026
Coal demand proves resilient as energy security concerns reshape power markets
June 23, 2026
South Asian coal demand supports stronger seaborne flows
June 15, 2026
Global coal market steadies as demand holds near record highs
June 15, 2026
Indonesian coal demand hits record high despite production cuts
June 2, 2026
Previous
Page
1
Page
2
Page
3
…
Page
8
Next
Recent Post
China coal power rises for sixth consecutive month
July 21, 2026
Russian coal exports to Turkey fall 26.9% in January–May 2026
July 20, 2026
Kuzbass coal production falls 3.6% in H1 2026 despite export growth
July 20, 2026
Russian coal industry to return $0.7 billion in tax deferrals amid mounting losses
July 20, 2026
Trending Posts
Coal production suspended at SUEK mine
June 21, 2025
Rosneft CEO addresses issue of TSR and BAM limited capacities
March 26, 2021
Ukraine’s coal imports up 10% in Jan-Feb 2021
March 19, 2021
RZD plans to raise rail tariffs to cover security costs
August 11, 2023