Skip to content
Search
X-twitter
Linkedin
Youtube
Home
Premium Content
Insights
Events
Industry Links
Coal Consultants
Coal Industry Association
Coal Industry News
Coal Price & Market Information
Government Organisation
Think Tank
Coal Company
About Us
Other Hubs
EUROPEAN GAS HUB
GLOBAL LNG HUB
GLOBAL MARITIME HUB
GLOBAL HYDROGEN HUB
GLOBAL MINERALS HUB
FREE TRIAL
My account
Login
€
0.00
0
Cart
€
0.00
0
Cart
Search
Home
Premium Content
Insights
Events
Industry Links
Coal Consultants
Coal Industry Association
Coal Industry News
Coal Price & Market Information
Government Organisation
Think Tank
Coal Company
About Us
Other Hubs
EUROPEAN GAS HUB
GLOBAL LNG HUB
GLOBAL MARITIME HUB
GLOBAL HYDROGEN HUB
GLOBAL MINERALS HUB
FREE TRIAL
My account
Login
X-twitter
Linkedin
Youtube
© 2025 TheCoalHub | All Rights Reserved
Author:
Editor
Kazakh coal transit through Russian ports rises 34% in H1 2026
July 27, 2026
Russian coal exports face 12 million tonne risk from Black Sea attacks
July 27, 2026
Global coal prices rise amid geopolitical tensions and stronger summer demand
July 27, 2026
China coal power rises for sixth consecutive month
July 21, 2026
Russian coal exports to Turkey fall 26.9% in January–May 2026
July 20, 2026
Kuzbass coal production falls 3.6% in H1 2026 despite export growth
July 20, 2026
Russian coal industry to return $0.7 billion in tax deferrals amid mounting losses
July 20, 2026
Global coal prices diverge as geopolitical risks support energy markets
July 20, 2026
Russian rail coal exports to China plunge 29.5% in January–June 2026
July 13, 2026
Russian coal exports via northwest and southern ports to lose tariff support
July 13, 2026
Previous
Page
1
Page
2
Page
3
…
Page
95
Next
Recent Post
Global coal prices decline as European, Chinese and Australian markets weaken
July 13, 2026
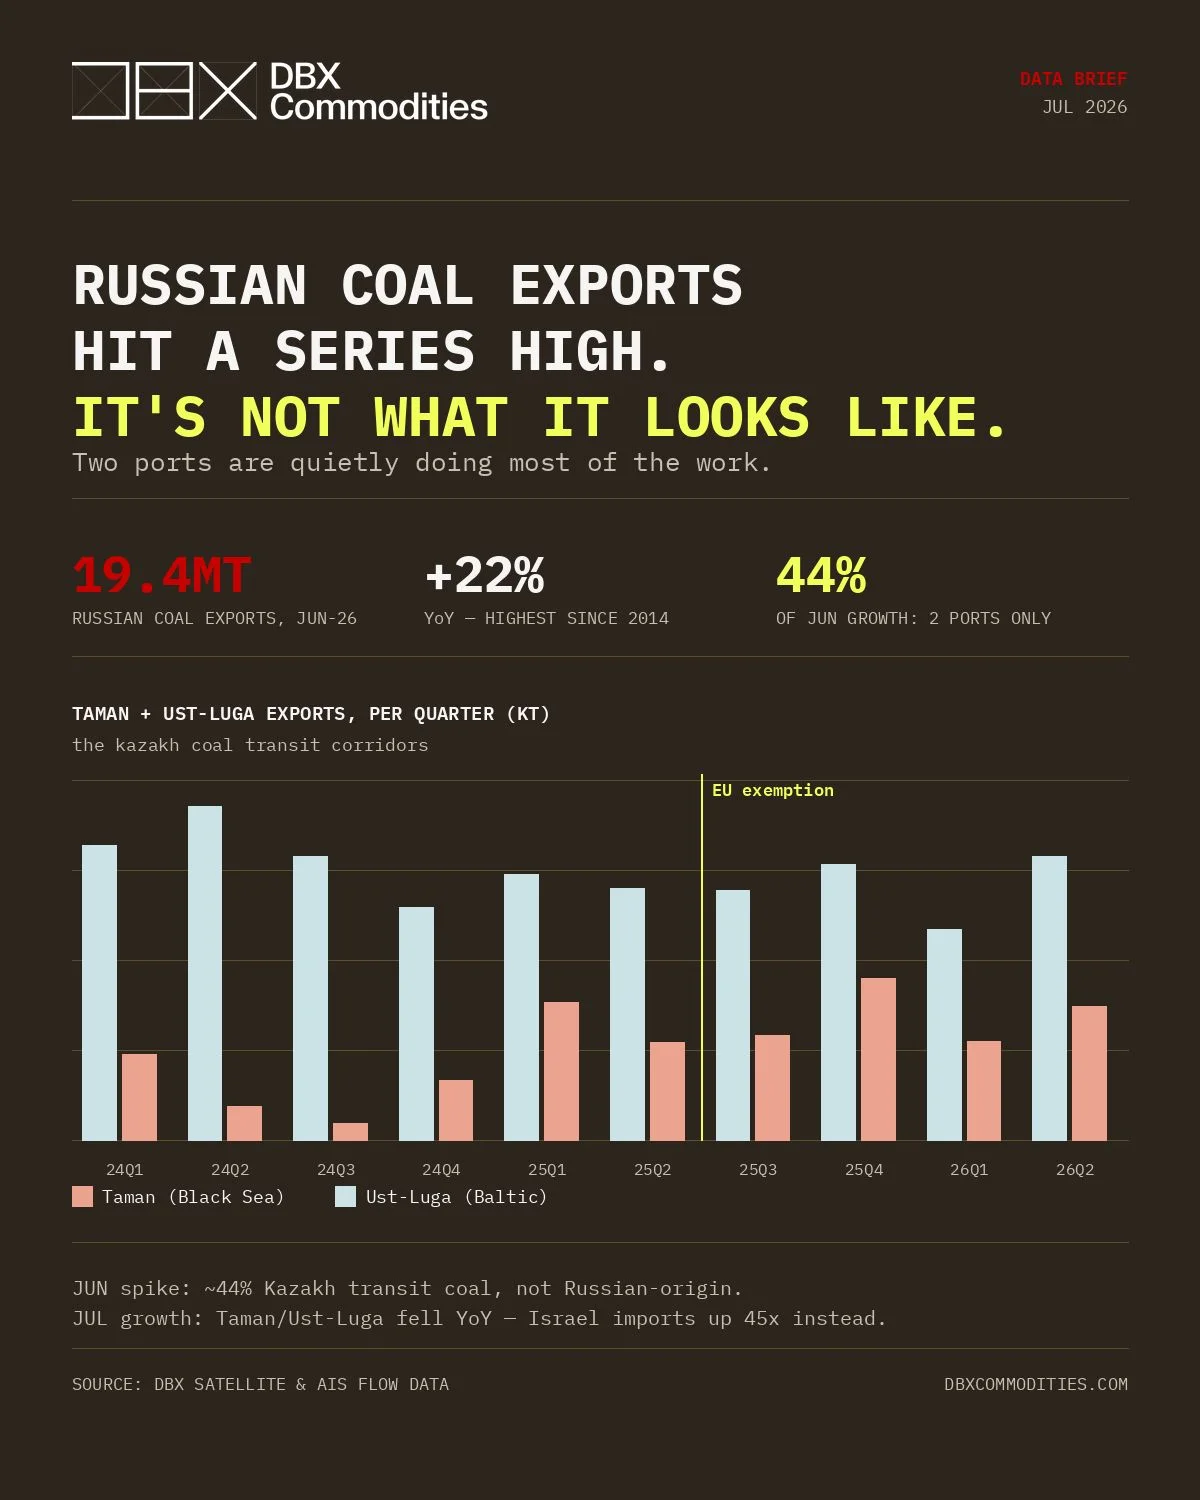
Russian coal exports hit a series high – but it’s not what it looks like
July 13, 2026
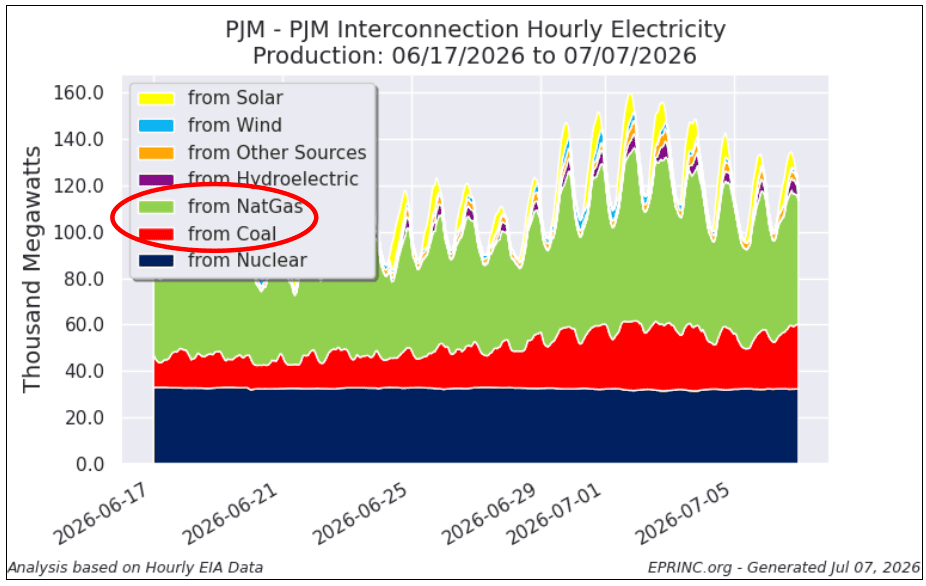
Coal and natural gas carried PJM electricity generation during U.S. heat wave
July 9, 2026
Russian coal crisis deepens as diesel market risks mount
July 7, 2026
Trending Posts
Coal production in Kuzbass down 8.9% in Jan-Jul 2022
August 26, 2022
Coal production in Kuzbass down 0.6% in January 2025
February 21, 2025
Weekly review of key global coal price indices
November 16, 2024
FEATURE: Power supply shortage hassles China provinces
October 1, 2021